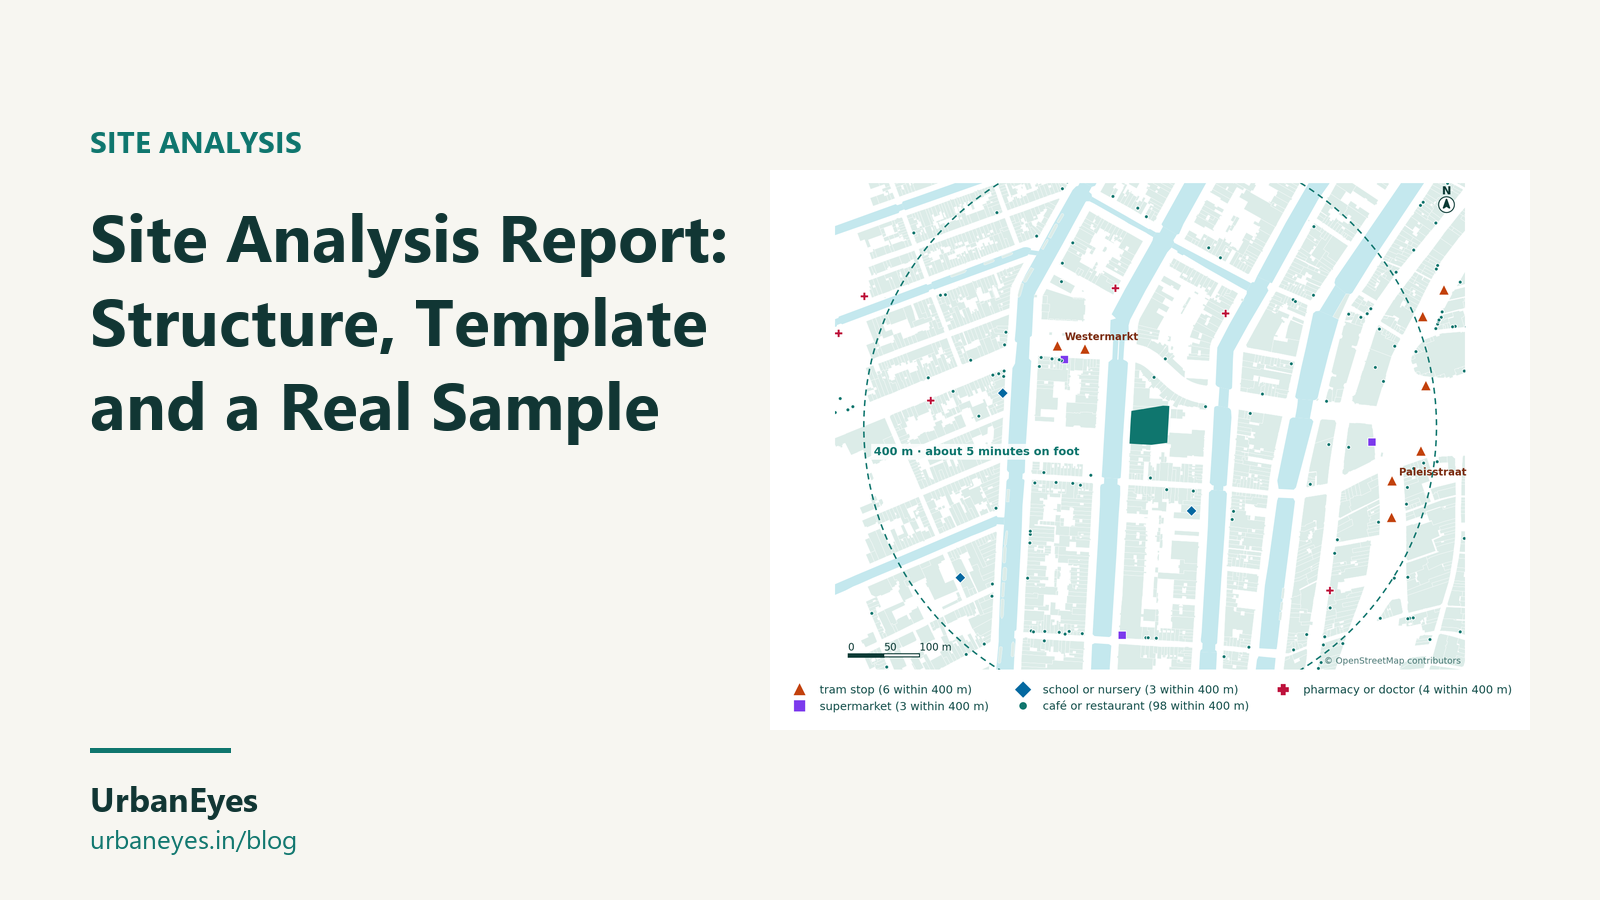
Site Analysis Report: Structure, Template and a Real Sample
A site analysis report sets out what a site is, what surrounds it, what rules apply and what that means for the design. A clear report has eight parts: summary, site and context, built form and heritage, uses and access, climate and environment, rules, opportunities and constraints, and sources. Each finding should end in a design consequence.
This guide gives the structure, a fill-in template for each chapter and real samples, written for a block on the Keizersgracht in Amsterdam and a plotted block in Green Park, New Delhi. Use it for a client report, a planning pre-application or a studio submission.
Last checked: October 2026.
What is a site analysis report for?
A report does three jobs that a board or sketchbook does not:
- It records evidence. Every figure has a source and a date, so someone can check it in a year.
- It argues. It links facts to design moves, so the client or planner sees why the scheme looks the way it does.
- It travels. It can be sent, printed, attached to an application and read without you in the room.
If you only need to present to a crit, a site analysis board is usually better. Most projects need both: the board for the conversation, the report for the record.
How should a site analysis report be structured?
| # | Chapter | What it answers | Typical length |
|---|---|---|---|
| 1 | Summary | What this site asks for, in five lines | Half a page |
| 2 | Site and context | Where it is, how big, what surrounds it | 1 to 2 pages |
| 3 | Built form and heritage | Grain, heights, ages, protected buildings | 1 to 2 pages |
| 4 | Uses and access | Amenities, transport, walking, servicing | 1 to 2 pages |
| 5 | Climate and environment | Temperature, rain, wind, sun, shadow, flood | 2 pages |
| 6 | Rules | Zoning, height, coverage, FAR, setbacks, heritage | 1 page |
| 7 | Opportunities and constraints | The synthesis diagram and design moves | 1 to 2 pages |
| 8 | Sources and appendix | Data sources, dates, photos, site visit notes | As needed |
Ten to fifteen pages is enough for most sites. Longer reports are rarely read further.
What goes in each chapter? A template and a sample
The template for each chapter is in italics; the sample below it comes from the real Keizersgracht site.
1. Summary
Template: the site in one sentence, its three strongest facts, and the three or four design moves they lead to.
Sample. A 2,325 m² block on the Keizersgracht in Amsterdam's canal ring, a UNESCO World Heritage Site. Its neighbours were built around 1760 on average, it sits within a five-minute walk of two tram stops and 98 places to eat, and it gets a 14° sun at midwinter noon. The scheme should complete the canal street wall at canal-house widths, match the neighbours' eaves, provide cycle rather than car parking, and give every home dual aspect.
2. Site and context
Template: location plan, site area, boundaries, and a figure-ground at 250 to 500 m with one sentence of reading.
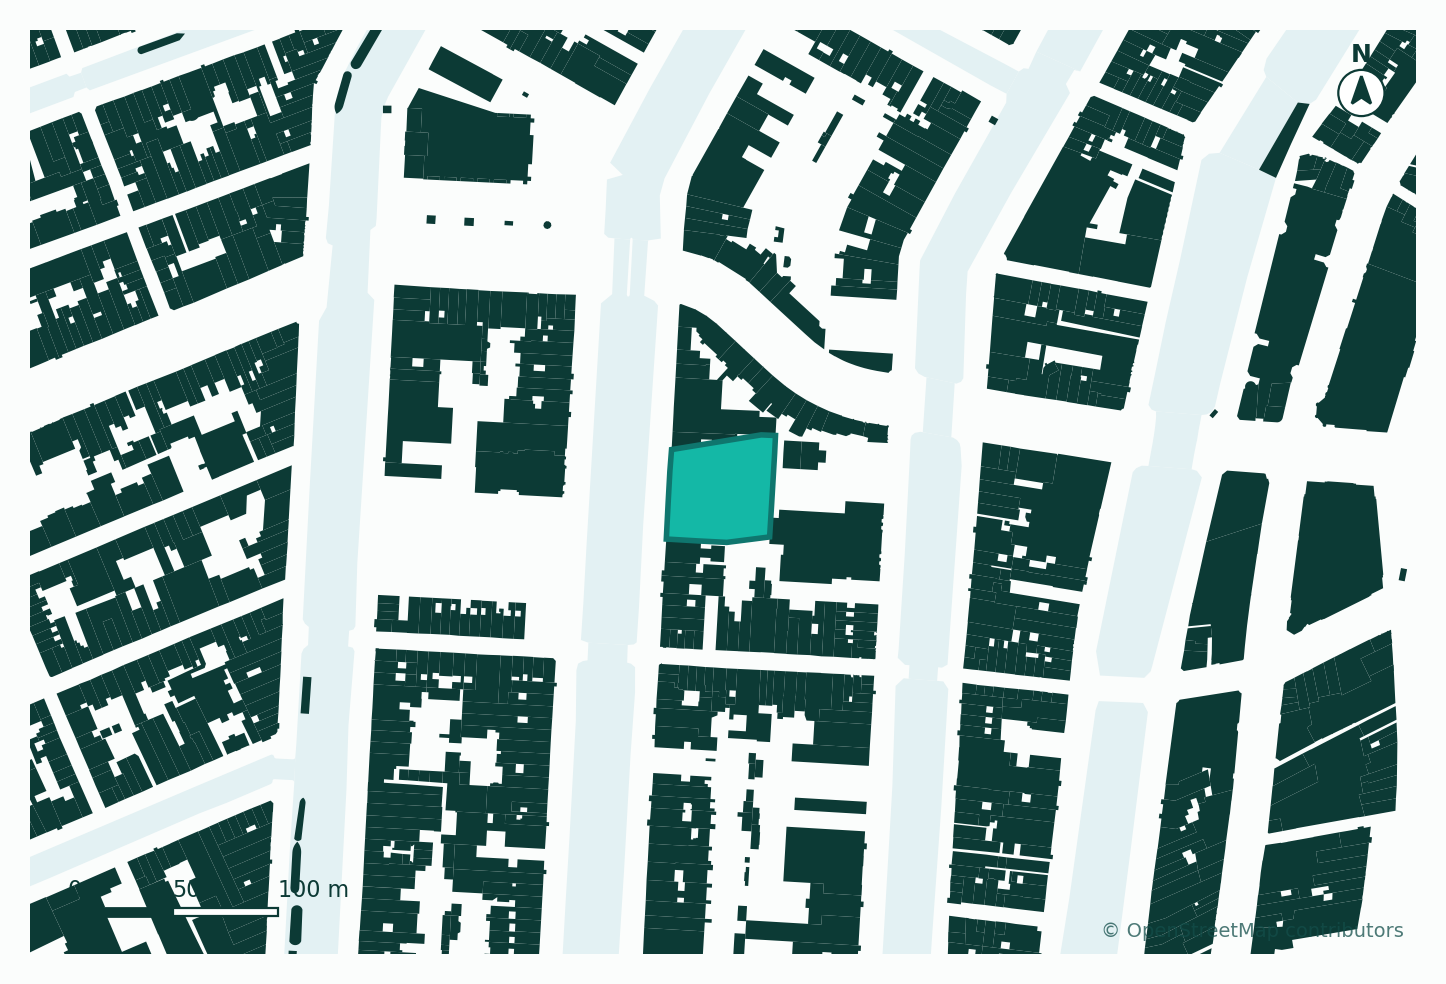
Sample. Within 250 m are 501 buildings covering 36% of the ground, with an average footprint of 141 m². Canal water covers roughly a quarter of the same circle. The blocks are closed perimeter blocks with private gardens inside; the canals are the public space.
3. Built form and heritage
Template: building heights and ages, listed buildings, protected areas, and what the planning authority will judge the scheme against.
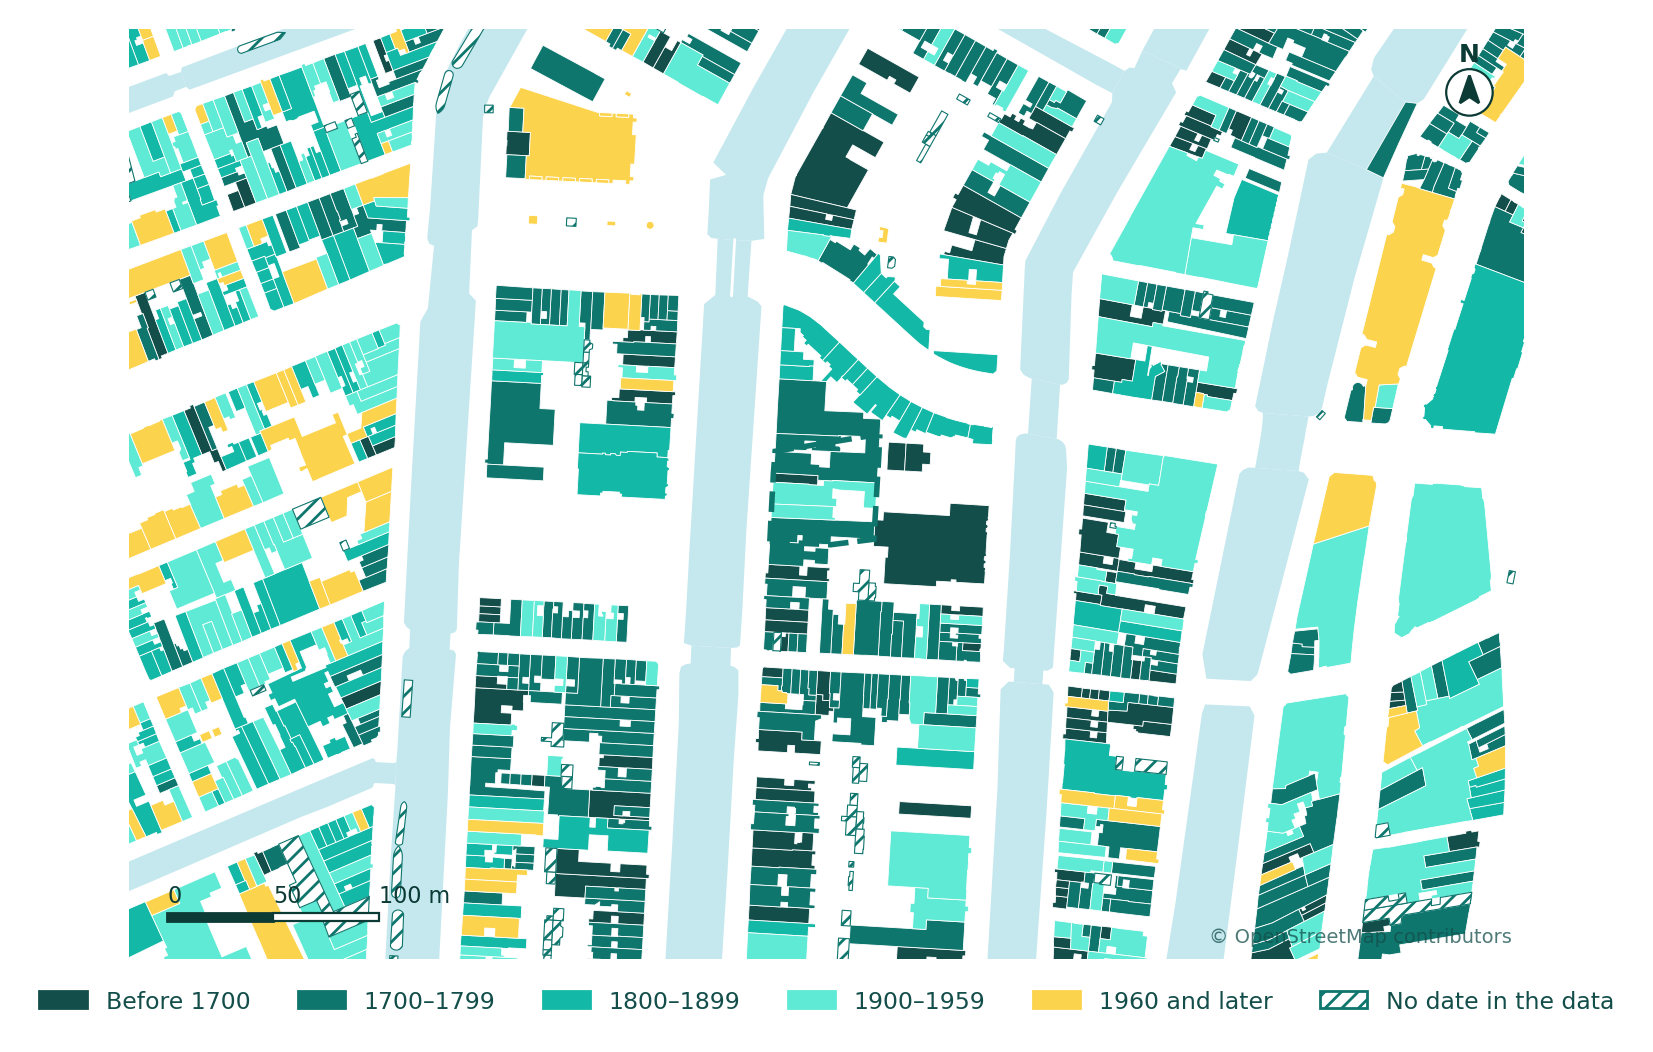
Sample. 445 of the 501 buildings carry a construction date. The median is 1760; 87 are older than 1700 and 38 are from 1960 or later. The canal ring is a protected cityscape, so height, roofline and facade rhythm will be judged against these neighbours.
4. Uses and access
Template: amenities within 400 and 800 m, transport stops and frequency, walking and cycling, vehicle and service access, and what it means for parking and ground floors.
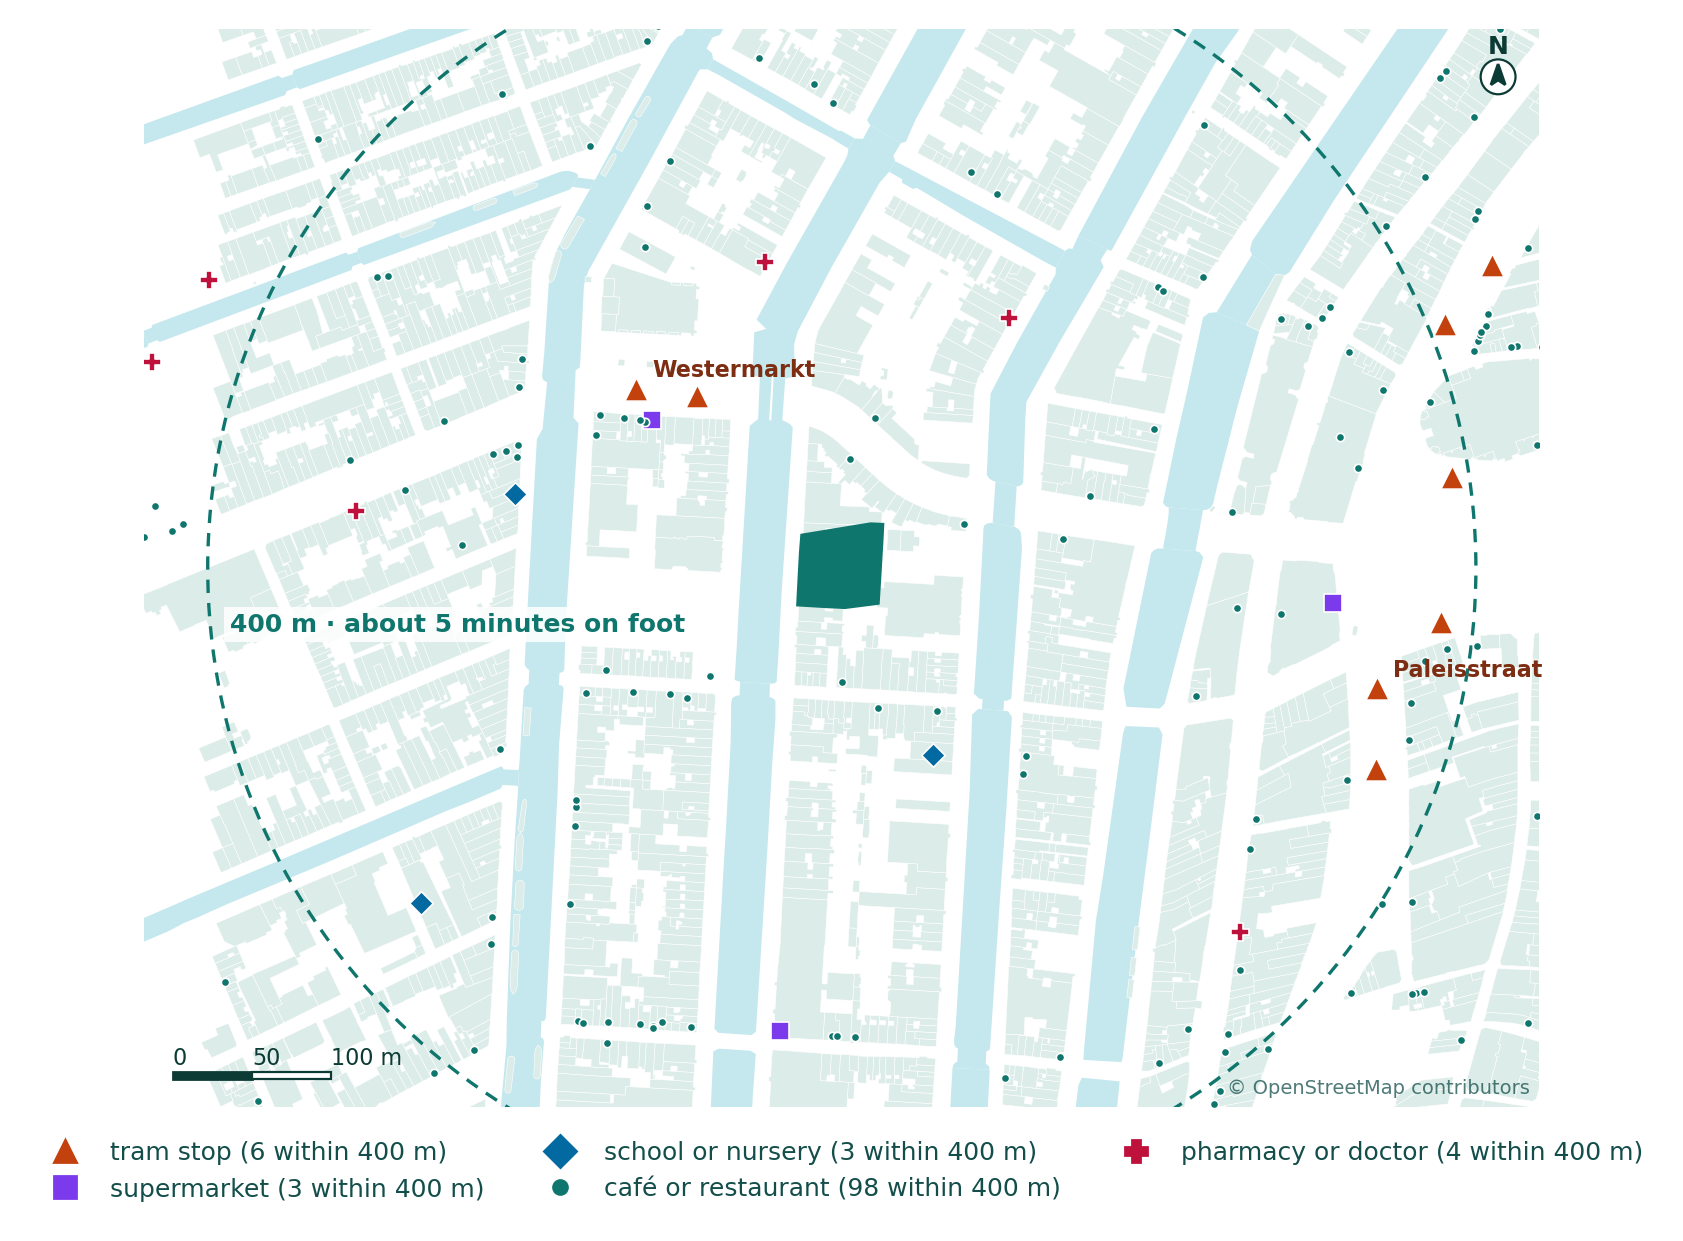
Sample. Within 400 m: 98 cafés and restaurants, 3 supermarkets, 3 schools or nurseries, 4 pharmacies or doctors, and tram stops at Westermarkt and Paleisstraat. No car parking is needed; cycle storage is. Shops belong on the side streets, homes and offices on the canal.
5. Climate and environment
Template: a climate table, a wind rose, a sun path with solstice angles, shadow notes and flood risk. Name the year and the source.
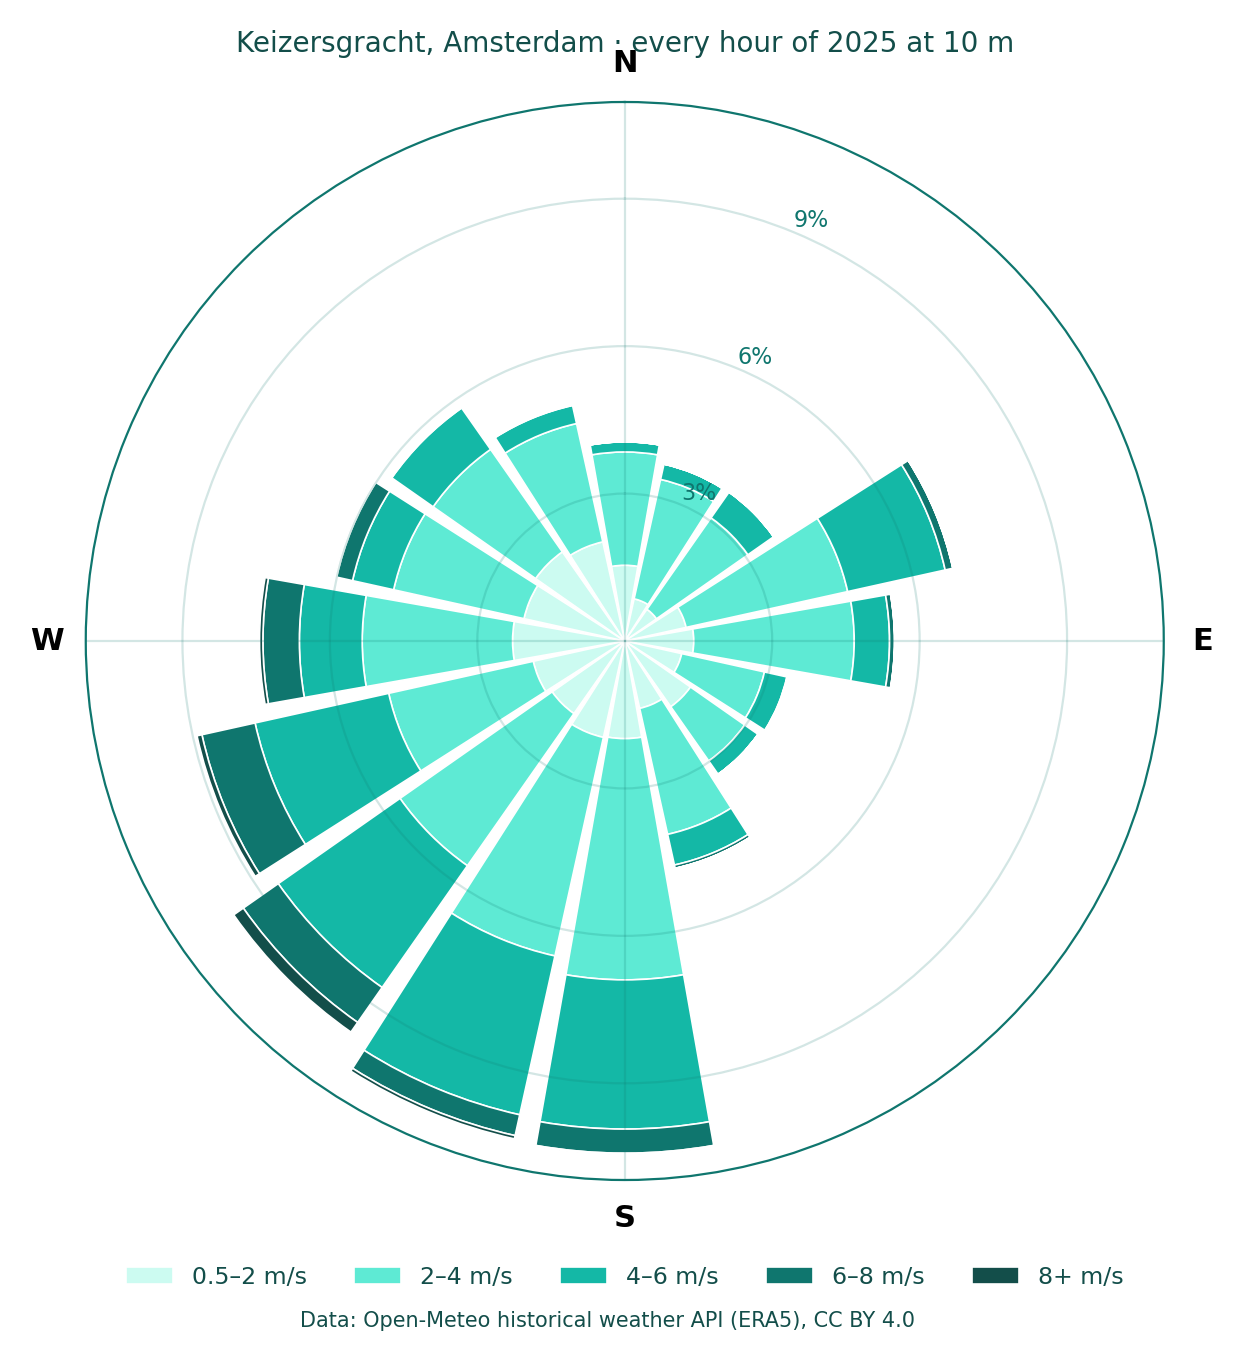
Sample (2025, Open-Meteo archive). Mean 11.3 °C; hottest day 34.8 °C; coldest night −4.1 °C; 778 mm of rain over 116 wet days. Wind from the south-west 19% of hours and the south 19%; calm 1.1%. Noon sun 61° on 21 June and 14° on 21 December.
6. Rules
Template: the plan or code that applies, the key numbers (height, coverage, FAR, setbacks, parking), any heritage controls, and a note on what must be confirmed with the authority.
Sample. Since 1 January 2024, Dutch planning runs through the municipality's omgevingsplan under the Environment and Planning Act. In the canal ring, protected cityscape and monument rules control height, rooflines, facades and demolition. To be confirmed with the City of Amsterdam before design.
You can test the floor area numbers with the free FAR calculator.
7. Opportunities and constraints
Template: one annotated diagram and a table of facts and design moves.
Sample.
Fact Design move 141 m² average footprint, closed blocks Complete the street wall; break volume into canal-house widths Median building from 1760 Match eaves and roof lines Two tram stops, 98 places to eat within 400 m No car parking; generous cycle storage South-west wind 19% of hours Shelter entrances and balconies on the south-west 14° sun in December Dual-aspect homes, living spaces towards the garden
8. Sources and appendix
Template: every dataset with its licence and date, site visit notes and photos.
Sample. Buildings, uses, ages and stops: OpenStreetMap contributors (ODbL), ages from the BAG register. Climate: Open-Meteo historical archive (ERA5), CC BY 4.0, 2025. Sun: NOAA solar equations. Figures made on 21 October 2026.
A second sample: the same chapters for a Delhi plot
Indian reports carry different weight in different chapters. Here are chapters 1, 3, 5 and 6 for a real plotted block in Green Park, New Delhi, with the rules worked for an example 300 m² plot in it. The full analysis is in the complete site analysis guide.
1. Summary (Delhi)
A 6,313 m² plotted block in Green Park, South Delhi, inside the regulated area of three ASI-protected monuments, 590 m from Green Park metro. For a 300 m² plot, the plot rules allow 675 m² of floor area on stilt plus four floors, but any construction first needs National Monuments Authority permission. The design should keep height and roofline modest, shade the west face against 40 °C afternoons, ventilate across the plan for light winds, and harvest monsoon rain.
3. Built form and heritage (Delhi)
Within 250 m: 174 mapped buildings covering 31.5% of the ground, median footprint 215 m². Footprints come from Overture Maps (OpenStreetMap, Google Open Buildings and Microsoft), because OpenStreetMap alone is incomplete here. Storey counts are recorded for 76 buildings only, so heights must be checked on site.
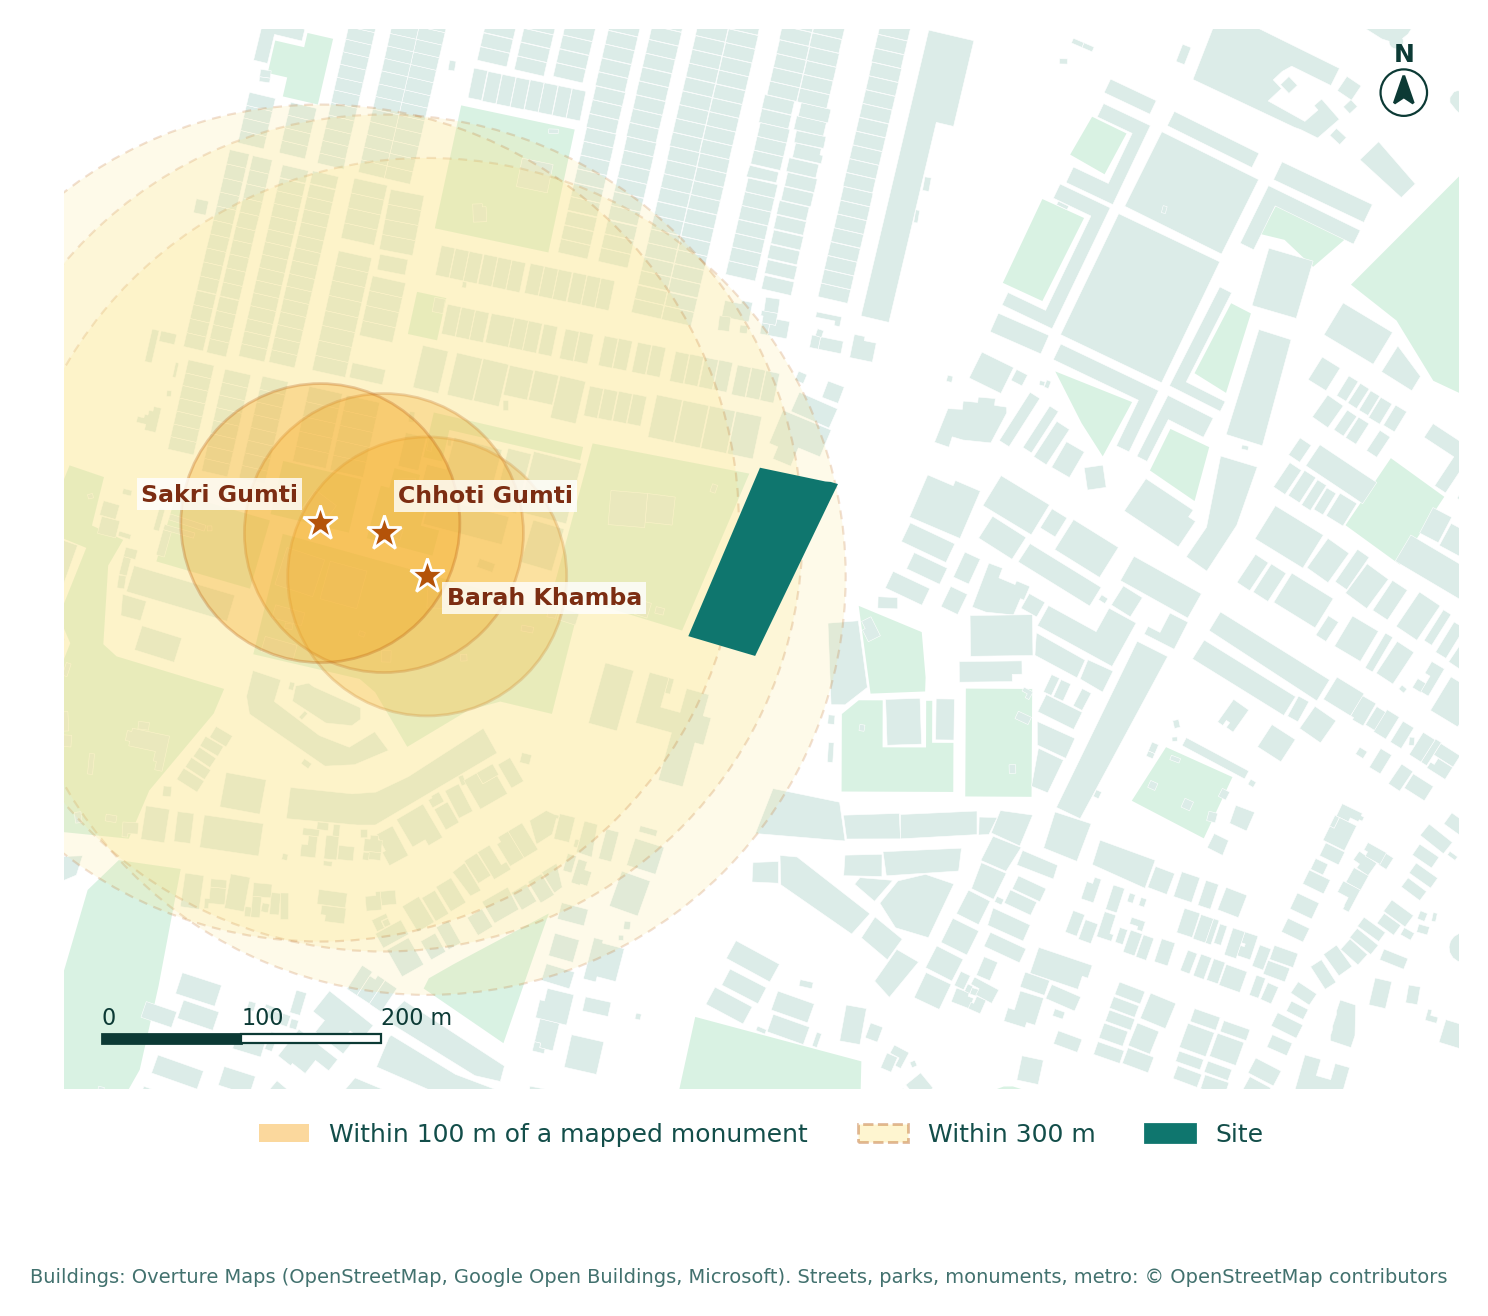
Bara Khamba (about 190 m), Chhoti Gumti (about 230 m) and Sakri Gumti (about 280 m) are centrally protected by the ASI. The block is inside the regulated area of all three under the AMASR Act: construction needs permission from the competent authority on the National Monuments Authority's recommendation. Distances are from mapped points and will be confirmed from the protected limits by survey.
5. Climate and environment (Delhi)
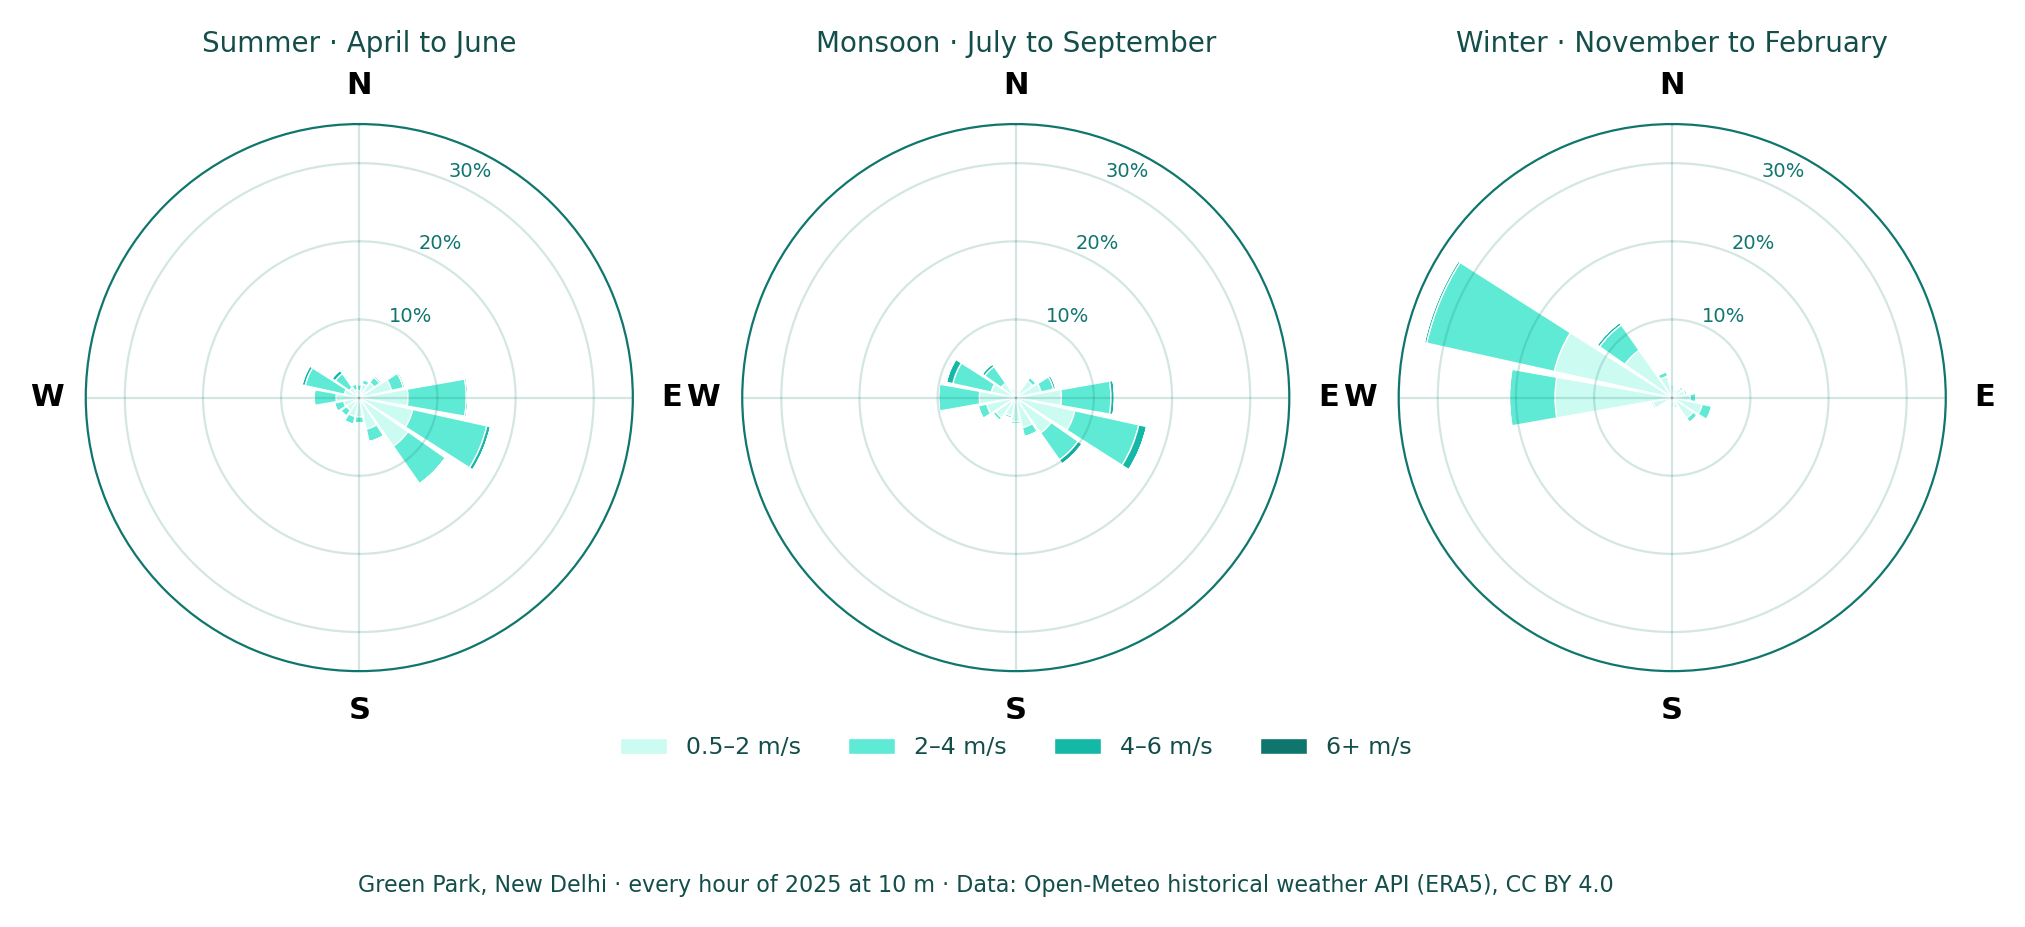
2025 (Open-Meteo archive, ERA5): mean 25.3 °C, hottest day 43.7 °C, 30 days at 40 °C or more; 716 mm of rain, 85% of it from June to September; humidity from 28% in April to 82% in August. Winds are light (1.8 m/s mean): from the west and north-west in winter, the east and south-east in summer and the monsoon. Noon sun: 85° in June, 38° in December.
6. Rules (Delhi)
MPD-2047 was notified on 20 August 2026. Pending a check of its regulations, the MPD-2021 plotted-housing norms (DDA handbook, 2023) apply to a plot of more than 250 and up to 500 m² as follows:
Rule Norm 300 m² plot Ground coverage 75% 225 m² FAR 225 675 m² Dwelling units 6 6 Setbacks (front, rear, sides) 3, 3, 3, 0 m Next smaller category's setbacks allowed if these block the coverage Height 15 m; 17.5 m with stilt parking Stilt plus four floors Parking 2 car spaces (plots of 250 to 300 m²) 2 Green building (UBBL 2016, 105 to 500 m²) Rainwater harvesting, solar PV, solar water heating, waste segregation All required Approval MCD online building permit system, after NMA permission Low-risk category under 15 m To be confirmed with the MCD and NMA before design.
The difference from the Amsterdam sample is the point: there, heritage shaped the design through the cityscape; here, it adds a separate approval and sets the programme.
What makes a site analysis report weak?
- Maps without sentences. Every figure needs a caption that says what it shows and why it matters.
- No sources or dates. A number without a source cannot be checked, and planners notice.
- Everything at the same weight. On a canal site, heritage deserves two pages and slope a line.
- No synthesis. Chapter 7 is the reason the report exists. If it is missing, the report is a data dump.
- Rules stated as certain. Say what was checked and what must be confirmed with the authority.
How can you produce the report faster?
Gather the facts with the 40-point site analysis checklist, then write the chapters. UrbanEyes Site Analysis produces most of chapters 2 to 6 for any address in about fifteen minutes: context maps, 50-plus figures, climate, sun and wind, and a feasibility screen for supported countries, each with its source. Chapters 1 and 7, the judgement, are yours. For the full method behind each chapter, read the complete site analysis guide.
Frequently Asked Questions
What should a site analysis report include?
A summary, site and context, built form and heritage, uses and access, climate and environment, planning rules, opportunities and constraints, and sources. Each section should end with what it means for the design.
How long should a site analysis report be?
Ten to fifteen pages for most sites. A large or sensitive site may need more, but put detail in an appendix and keep the main chapters short.
What is the difference between a site analysis report and a site analysis board?
A report is a written record with sources, sent and read alone. A board is a visual summary presented in person. Most projects need both.
Is there a free site analysis report template?
Yes. The chapter structure and template text in this guide are free to copy. The site analysis checklist gives the facts to fill it with.
Can AI write a site analysis report?
AI tools can gather data, draft maps and summarise figures. The synthesis, deciding which facts matter and what the design should do about them, still needs an architect, and every figure needs a checkable source.

Vinayak Tiwari
Founder, UrbanEyes
Computational designer trained at IAAC Barcelona. Vinayak built every UrbanEyes product, from Site Analysis to Maps and Boards, after years of doing site studies by hand.
We analyse, you design.
Run data-backed site analysis with UrbanEyes: maps, metrics, and reports in about 15 minutes.