Site Analysis in Architecture: The Complete Guide, on Two Real Sites
Site analysis in architecture is the study of a site and everything around it before design begins: its context, history, access, climate, sun, wind, landform and the rules that apply. It tells you what the site gives you, what it limits and what the brief must answer. A good one ends in clear design moves, not a stack of maps.
Most guides explain site analysis with a student's diagrams of an imaginary plot. This one works through two real sites from start to finish: a block on the Keizersgracht in Amsterdam's canal ring, among 400-year-old canal houses, and a plotted residential block in Green Park, New Delhi, beside three protected medieval monuments. Every number below comes from open data or official documents you can check, and every map was made from that data.
Last checked: October 2026.
What is site analysis in architecture?
Site analysis is the research an architect does on a site before the first sketch. It answers four questions:
- What is there? Buildings, streets, water, trees, ground levels and uses.
- What happens there? How people arrive, where they gather, how the sun and wind move across it.
- What is allowed? Zoning, height limits, heritage protection, setbacks and floor area rules.
- So what? Which of those facts should shape the design, and how.
The fourth question is the one most site analyses skip. A figure-ground map is not analysis on its own; the sentence under it ("the block is closed on three sides, so the entrance belongs on the canal") is.
What does a site analysis include?
A complete site analysis covers the same headings on almost every project. The weight of each changes with the site: on a canal-side block in Amsterdam, heritage and water matter far more than slope.
| Heading | What you look at | Typical output |
|---|---|---|
| Location and context | The site in its city, neighbourhood and street | Location plan, figure-ground |
| Built form and grain | Building footprints, heights, density, plot sizes | Figure-ground, height map, section |
| History and heritage | Building ages, listed buildings, protected views | Building age map, heritage notes |
| Uses and activity | Shops, homes, schools, workplaces nearby | Land use and amenity map |
| Access and movement | Streets, public transport, walking and cycling | Access map, walking-distance rings |
| Climate | Temperature, rain, prevailing wind | Climate table, wind rose |
| Sun and shadow | Sun angles through the year, overshadowing | Sun path diagram, shadow studies |
| Landform and ground | Levels, water, soil, drainage | Contours, section, flood notes |
| Rules | Zoning, height, coverage, floor area, setbacks | Rules summary, buildable envelope |
| Opportunities and constraints | The synthesis | One annotated diagram, a list of design moves |
For a printable version, use the site analysis checklist with all 40 items.
How do you do a site analysis, step by step?
Site analysis runs in three stages. Do them in this order; each one makes the next faster.
1. The desk study
Before visiting, gather what can be known from data: maps, building footprints and heights, land use, transport, climate and the planning rules. This used to take days of tracing and searching. Today most of it can be pulled from open data for any address, as we did for the Keizersgracht block below.
2. The site visit
Go with the maps printed and a question for each. Check what data cannot tell you: the noise at 8 a.m., which shop fronts are empty, where people actually cross, the condition of the party walls, the view from the bridge. Photograph and pin each observation to the plan.
3. The synthesis
Put the findings side by side and decide what matters. The output is a short list of design moves, each tied to a fact: "Keep the canal frontage continuous: every building on this stretch is 17th or 18th century." A site analysis board or report then presents the evidence behind each move.
Worked example: a Keizersgracht block in Amsterdam
The site is a block on the Keizersgracht, in the Grachtengordel, the 17th-century canal ring that is a UNESCO World Heritage Site and a protected cityscape. The site area is 2,325 m². The scheme we test on it later in this guide is made up; the site and its data are real.
Context and built form
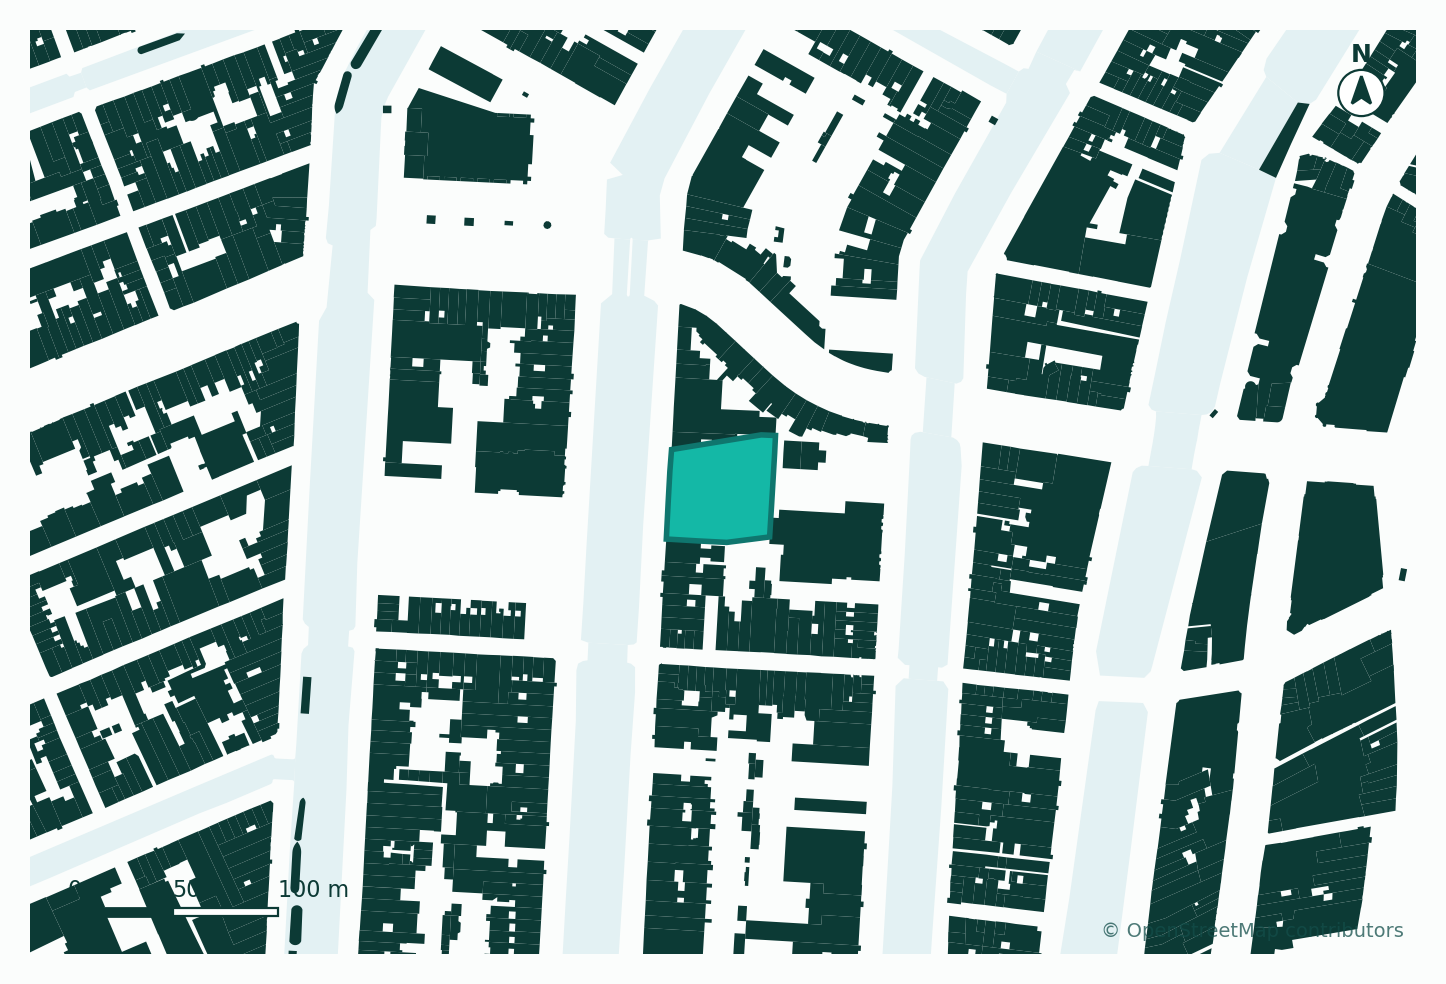
Within 250 m of the site there are 501 buildings, covering 36% of the ground, with an average footprint of only 141 m². That small grain is the narrow canal house: deep, tall, three to five windows wide. Canal water takes up roughly a quarter of the ground in the same circle.
What the figure-ground says for design: the blocks are closed perimeter blocks with private gardens inside, and the canals are the public space. A new building here completes a street wall; it does not stand as an object.
History and heritage
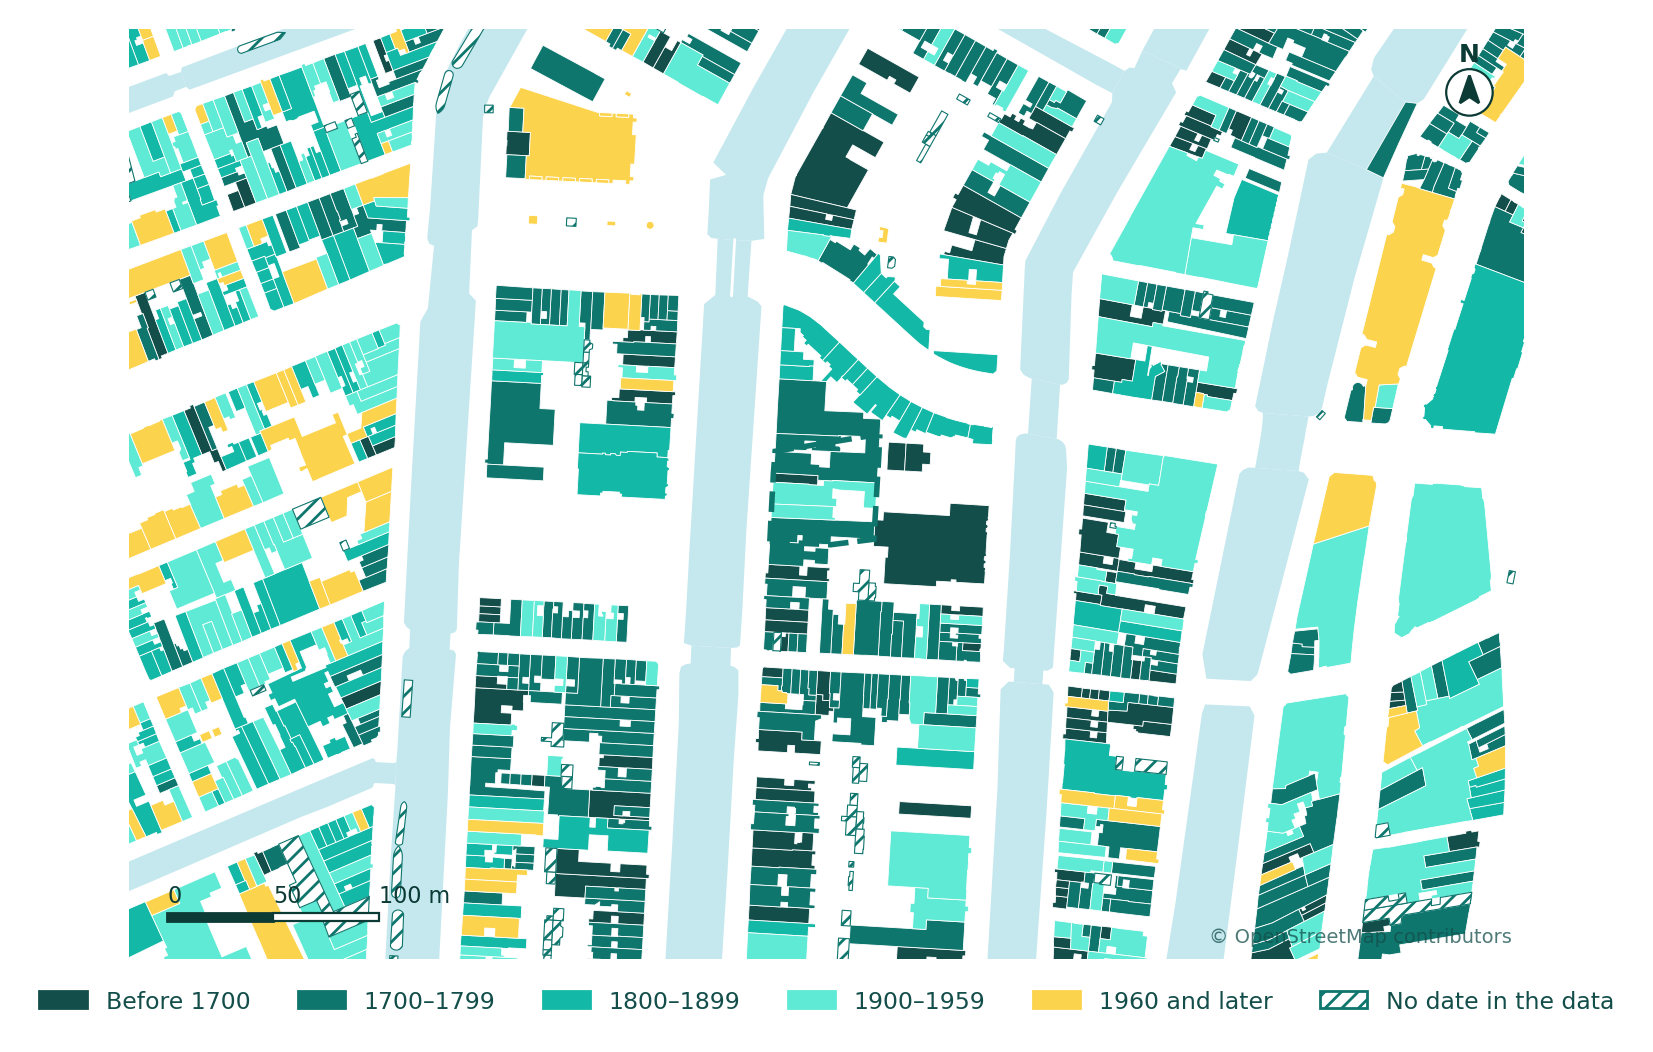
Of the 501 buildings, 445 carry a real construction date (54 more carry the BAG register's placeholder year, 1005, which means "unknown", and we left them out). The median building was built in 1760. 87 date from before 1700, the oldest from 1615; only 38 are from 1960 or later.
What it says for design: you are adding to a set piece. Height, roofline, window rhythm and materials will be judged against neighbours that are two to four centuries old, and permits in a protected cityscape are tested against exactly that.
Uses and access
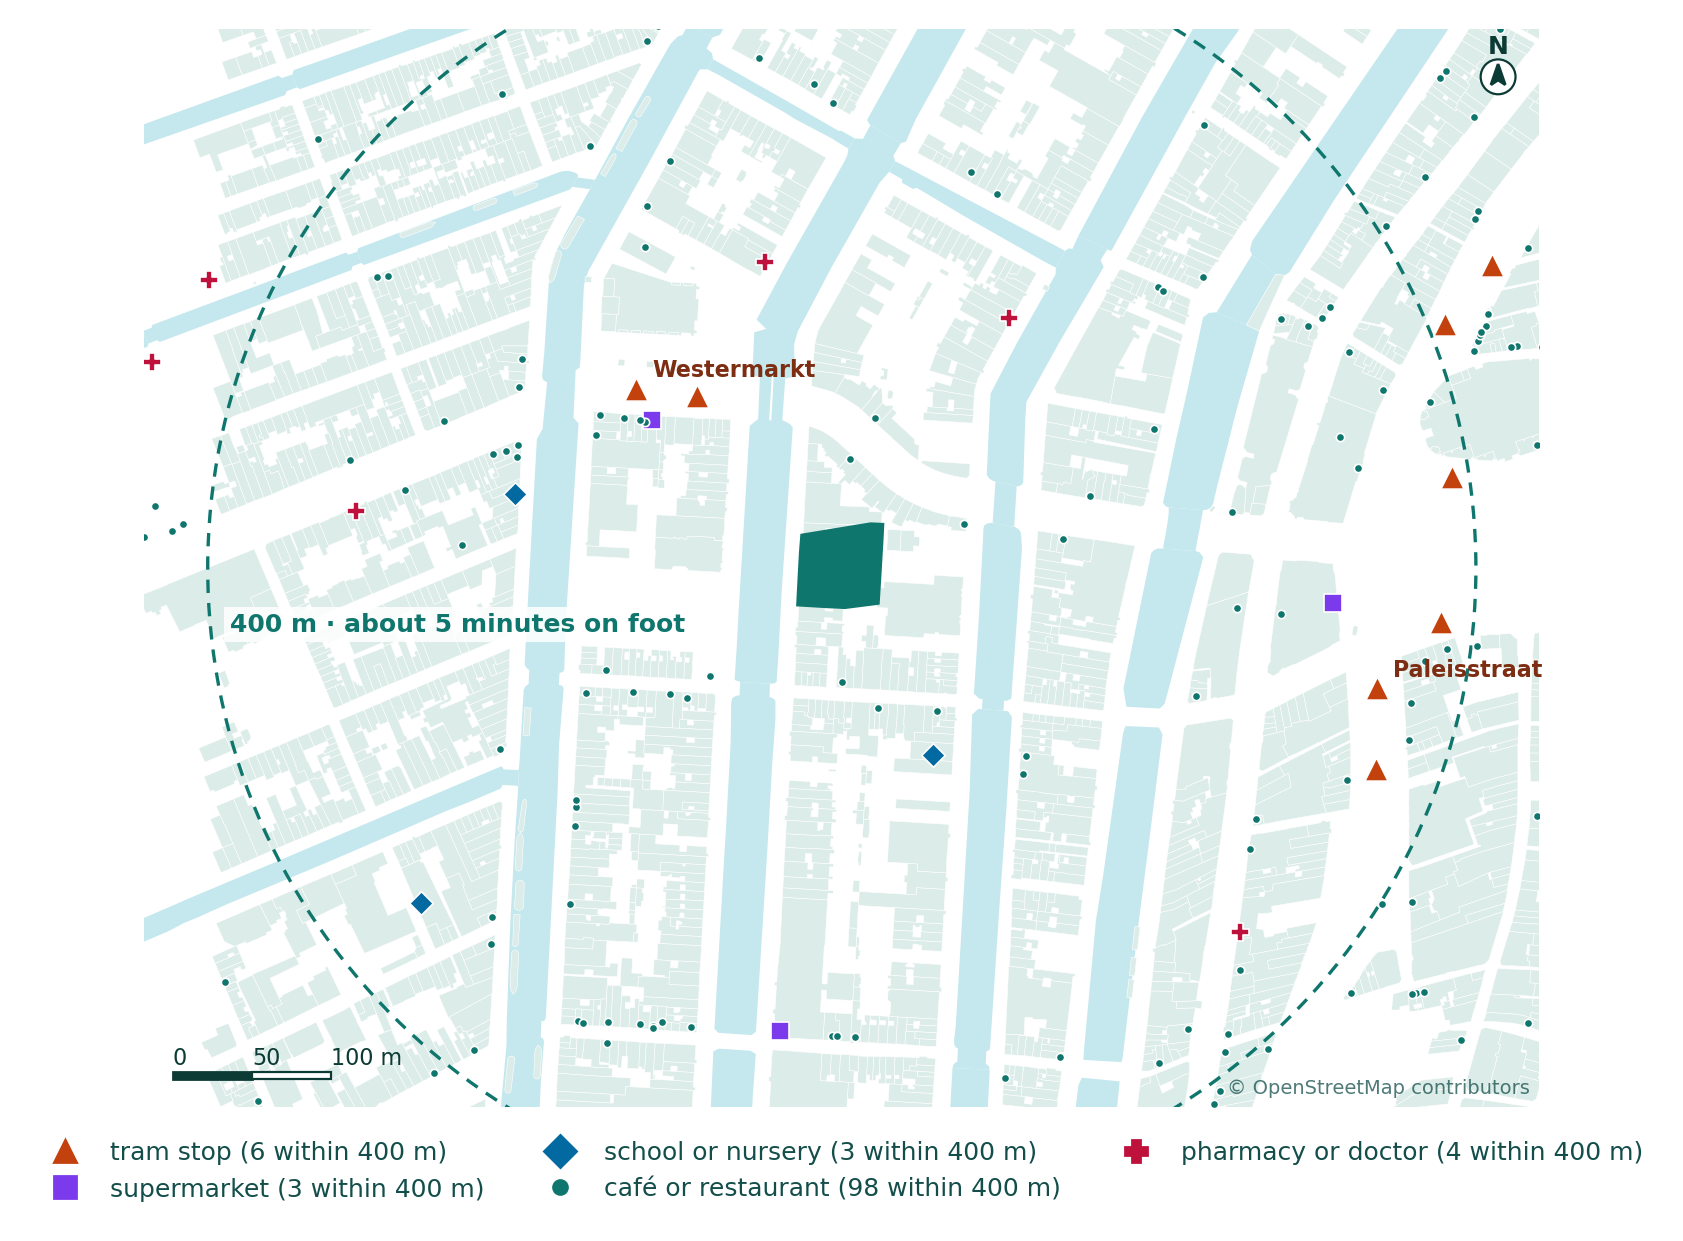
Within 400 m, about five minutes on foot, there are 98 cafés and restaurants, 3 supermarkets, 3 schools or nurseries and 4 pharmacies or doctors, and tram stops at Westermarkt and Paleisstraat. The side streets of the "9 Straatjes" are lined with shops and food at ground floor, while the canal fronts are mostly homes and offices.
What it says for design: no parking is needed or expected; cycle storage is. A shop or café at ground floor belongs on a side street; on the canal itself, homes and offices are the norm.
Climate and wind
The site's climate for 2025, from the Open-Meteo historical archive (ERA5 reanalysis) at the site:
| Measure | 2025 |
|---|---|
| Mean temperature | 11.3 °C |
| Hottest day / coldest night | 34.8 °C / −4.1 °C |
| Days at 25 °C or more | 17 |
| Frost nights | 38 |
| Rain | 778 mm over 116 wet days |
| Mean wind speed at 10 m | 3.1 m/s |
| Calm hours | 1.1% |
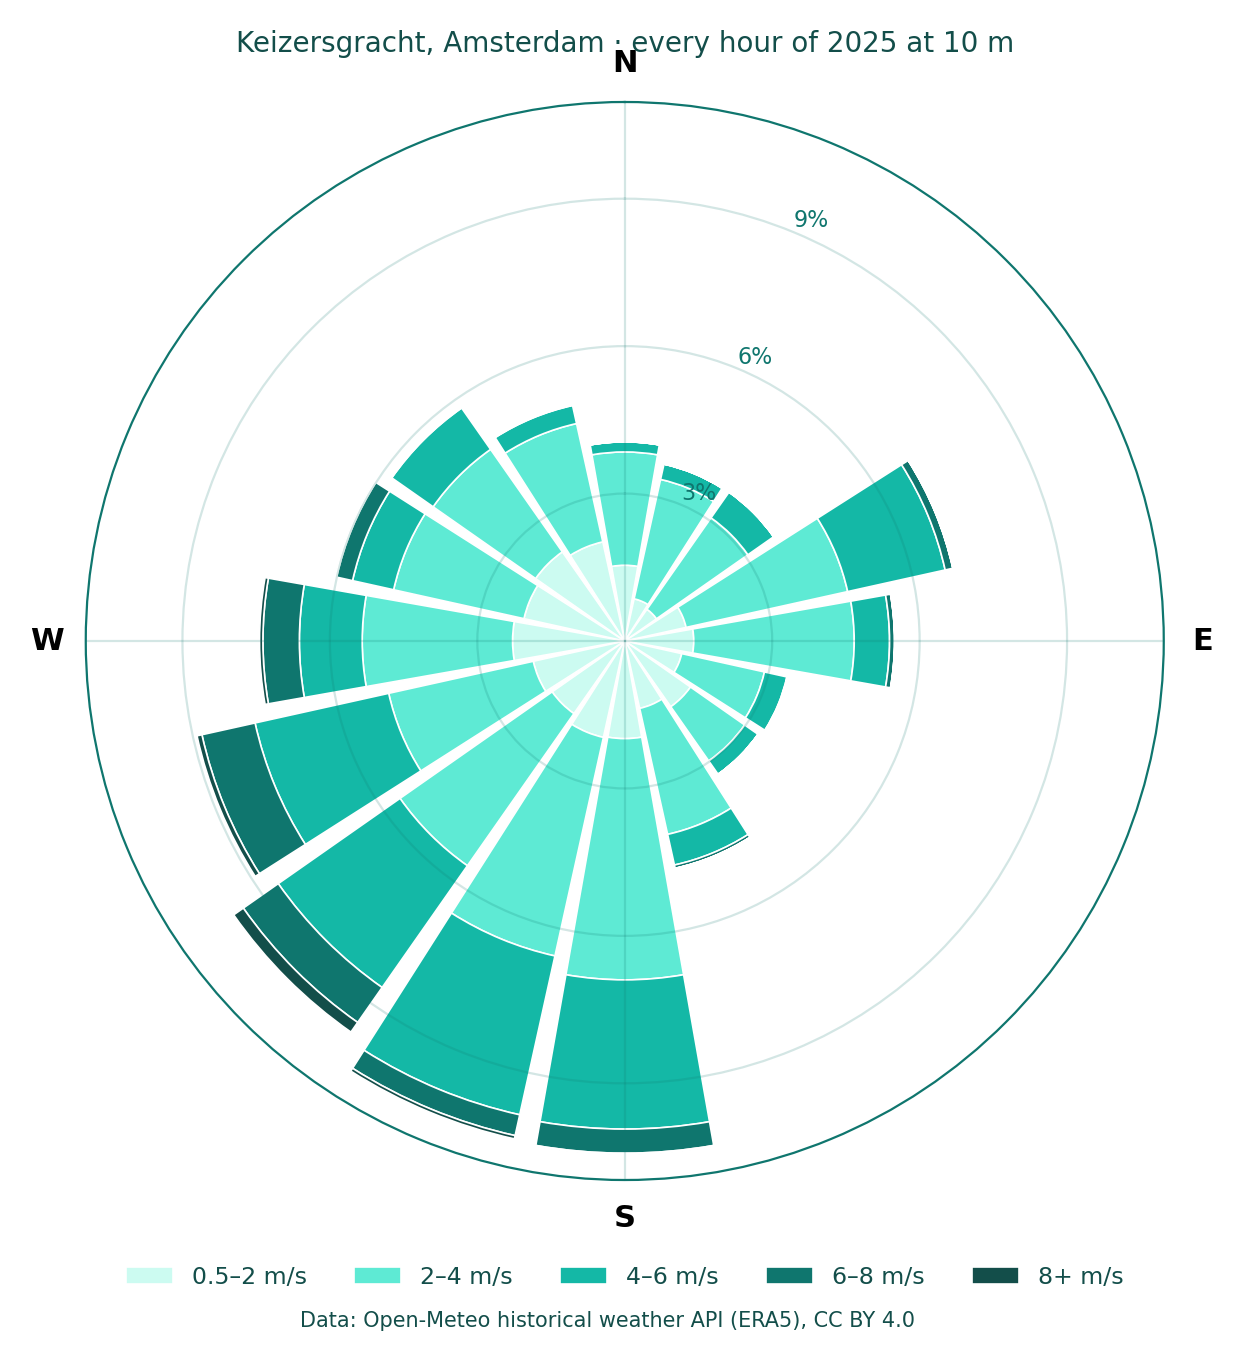
The wind comes most often from the south-west (19% of hours) and south (19%), then the west (15%), and is almost never still. In the canal streets it channels along the water.
What it says for design: shelter entrances and balconies on the south-west faces, and expect the canal to act as a wind corridor.
Sun and shadow
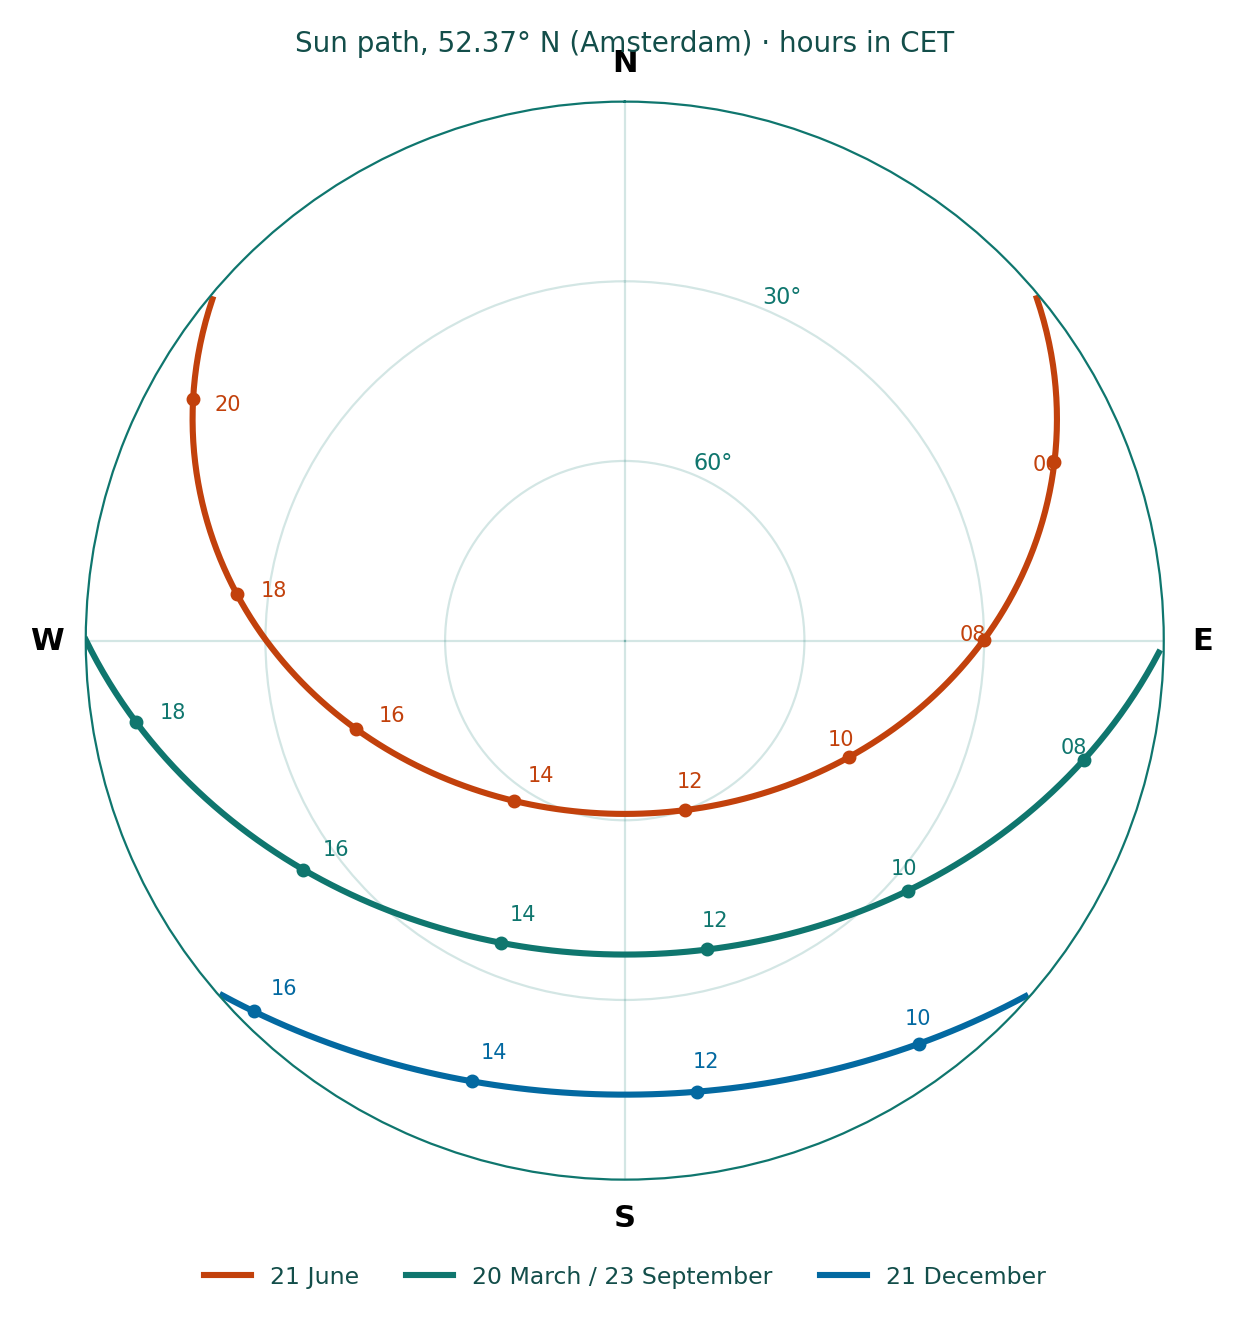
At this latitude the sun reaches 61° at noon on 21 June but only 14° on 21 December, when the day lasts 7.7 hours. A 14° sun casts a shadow about four times the height of whatever casts it: an 18 m canal house throws a 71 m shadow at midwinter noon, across the whole canal. Use the free sun path diagram and shadow length calculator to run your own site.
What it says for design: in winter, the canal-facing north side of a block gets almost no direct sun; homes need dual aspect, and the inner garden is the sunny side in summer.
Rules
Planning in the Netherlands has run through the omgevingsplan (environment plan) under the Environment and Planning Act since 1 January 2024. In the canal ring the decisive rules are the protected cityscape and monument status, which control height, rooflines, facades and demolition more tightly than any floor area figure. Always confirm with the municipality; the feasibility notes in a data tool are a first screen, not a permit.
The synthesis: what this site asks for
| Fact | Design move |
|---|---|
| Closed perimeter blocks, 141 m² average footprint | Complete the street wall; break any large volume into canal-house widths |
| Median building from 1760, protected cityscape | Match eaves and roof lines; the scheme is judged against its neighbours |
| 98 places to eat within 400 m, two tram stops | No parking; generous cycle storage; active ground floor only on side streets |
| South-west wind 19% of hours | Shelter entrances and balconies on the south-west |
| 14° sun in December | Dual-aspect homes; put living spaces towards the garden |
That table is the site analysis. Everything above it is the evidence.
Second worked example: a plotted block in Green Park, New Delhi
The same method gives a very different answer in a different city. This site is a plotted residential block in Green Park, South Delhi: 6,313 m², about 140 m by 50 m, with six mapped buildings on it. The worked rules below are for one example plot of 300 m² in the block.
Context and built form
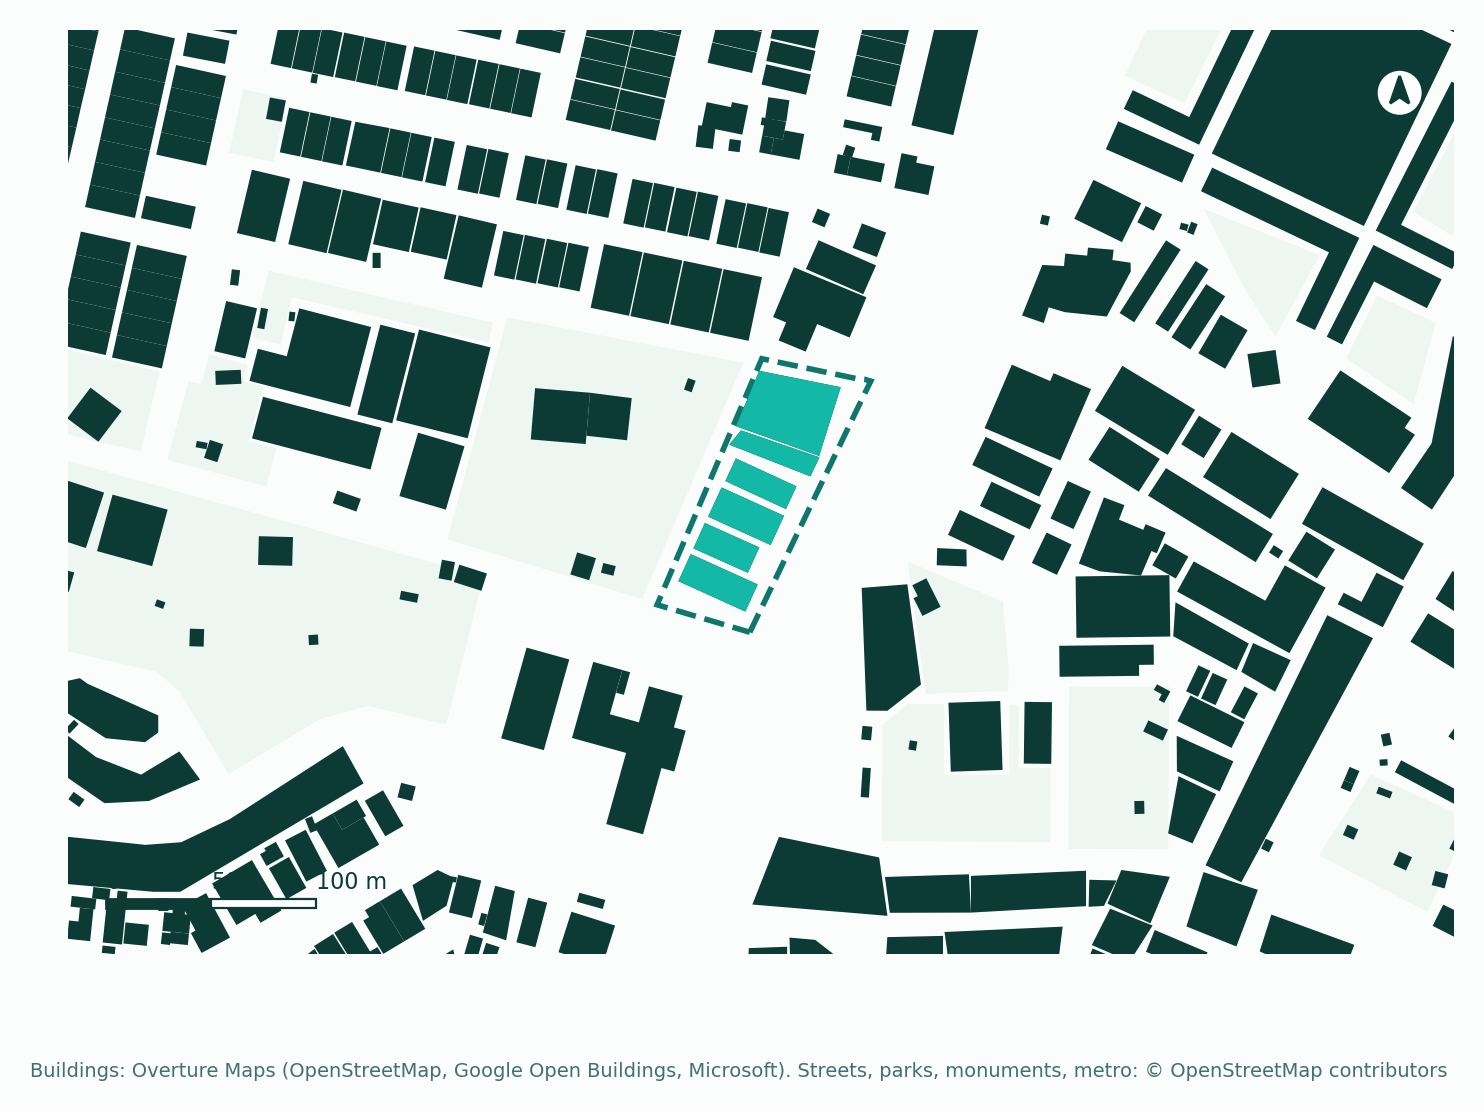
Within 250 m there are 174 mapped buildings covering 31.5% of the ground. The median footprint is 215 m² and the mean 360 m²: detached and semi-detached plotted houses, with larger institutional buildings to the east. Parks and green strips cover 16% of the same circle.
A note on the data: OpenStreetMap is thin in many Indian neighbourhoods, so these footprints come from Overture Maps, which combines OpenStreetMap with Google Open Buildings and Microsoft's machine-learned footprints. Storey counts are recorded for only 76 of the 174 buildings, almost all tagged as four floors, so heights here must be checked on site. That is a finding in itself: in many Indian cities, the site visit is where height data comes from.
What it says for design: the block is a row of plots facing the street, not a perimeter block. Each building stands back from its neighbours on at least some sides, so setbacks, not party walls, shape the plan.
Heritage: the decisive constraint
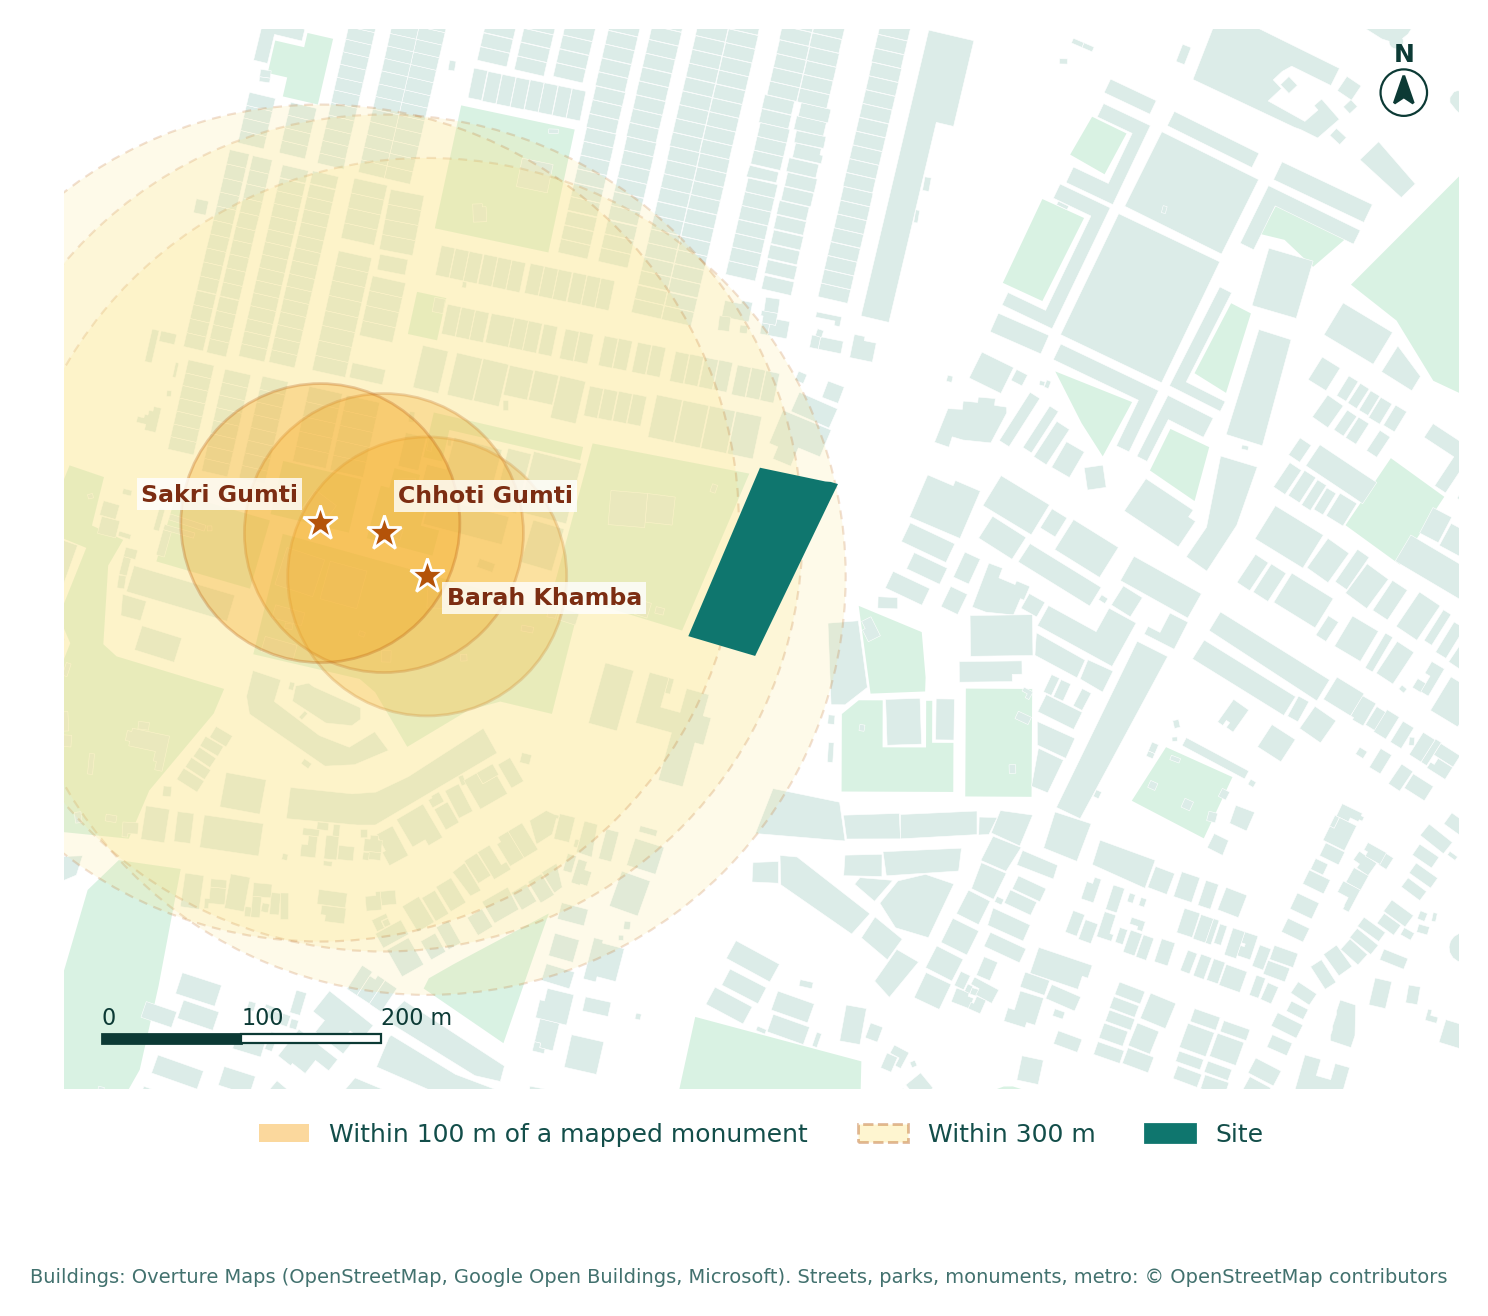
Three monuments centrally protected by the Archaeological Survey of India stand west of the block: Bara Khamba, about 190 m away; Chhoti Gumti, about 230 m; and Sakri Gumti, about 280 m, measured from each monument's mapped point. Under the Ancient Monuments and Archaeological Sites and Remains (AMASR) Act, as amended in 2010:
- the prohibited area runs 100 m from the limit of a protected monument, where no new construction is allowed;
- the regulated area runs a further 200 m beyond it, where any construction, repair or renovation needs permission. The competent authority grants it on the recommendation of the National Monuments Authority (NMA), whose recommendation is final.
The block sits inside the regulated area of all three. Distances count from the protected limits, not the mapped point, so a survey must confirm them. We found no published heritage bye-laws for these monuments, so any height limit the NMA sets would be decided case by case.
What it says for design: allow time for an NMA application before the building plan goes to the MCD, and expect height and facade to be judged against the monuments' setting, not only against the plot rules.
Uses and access
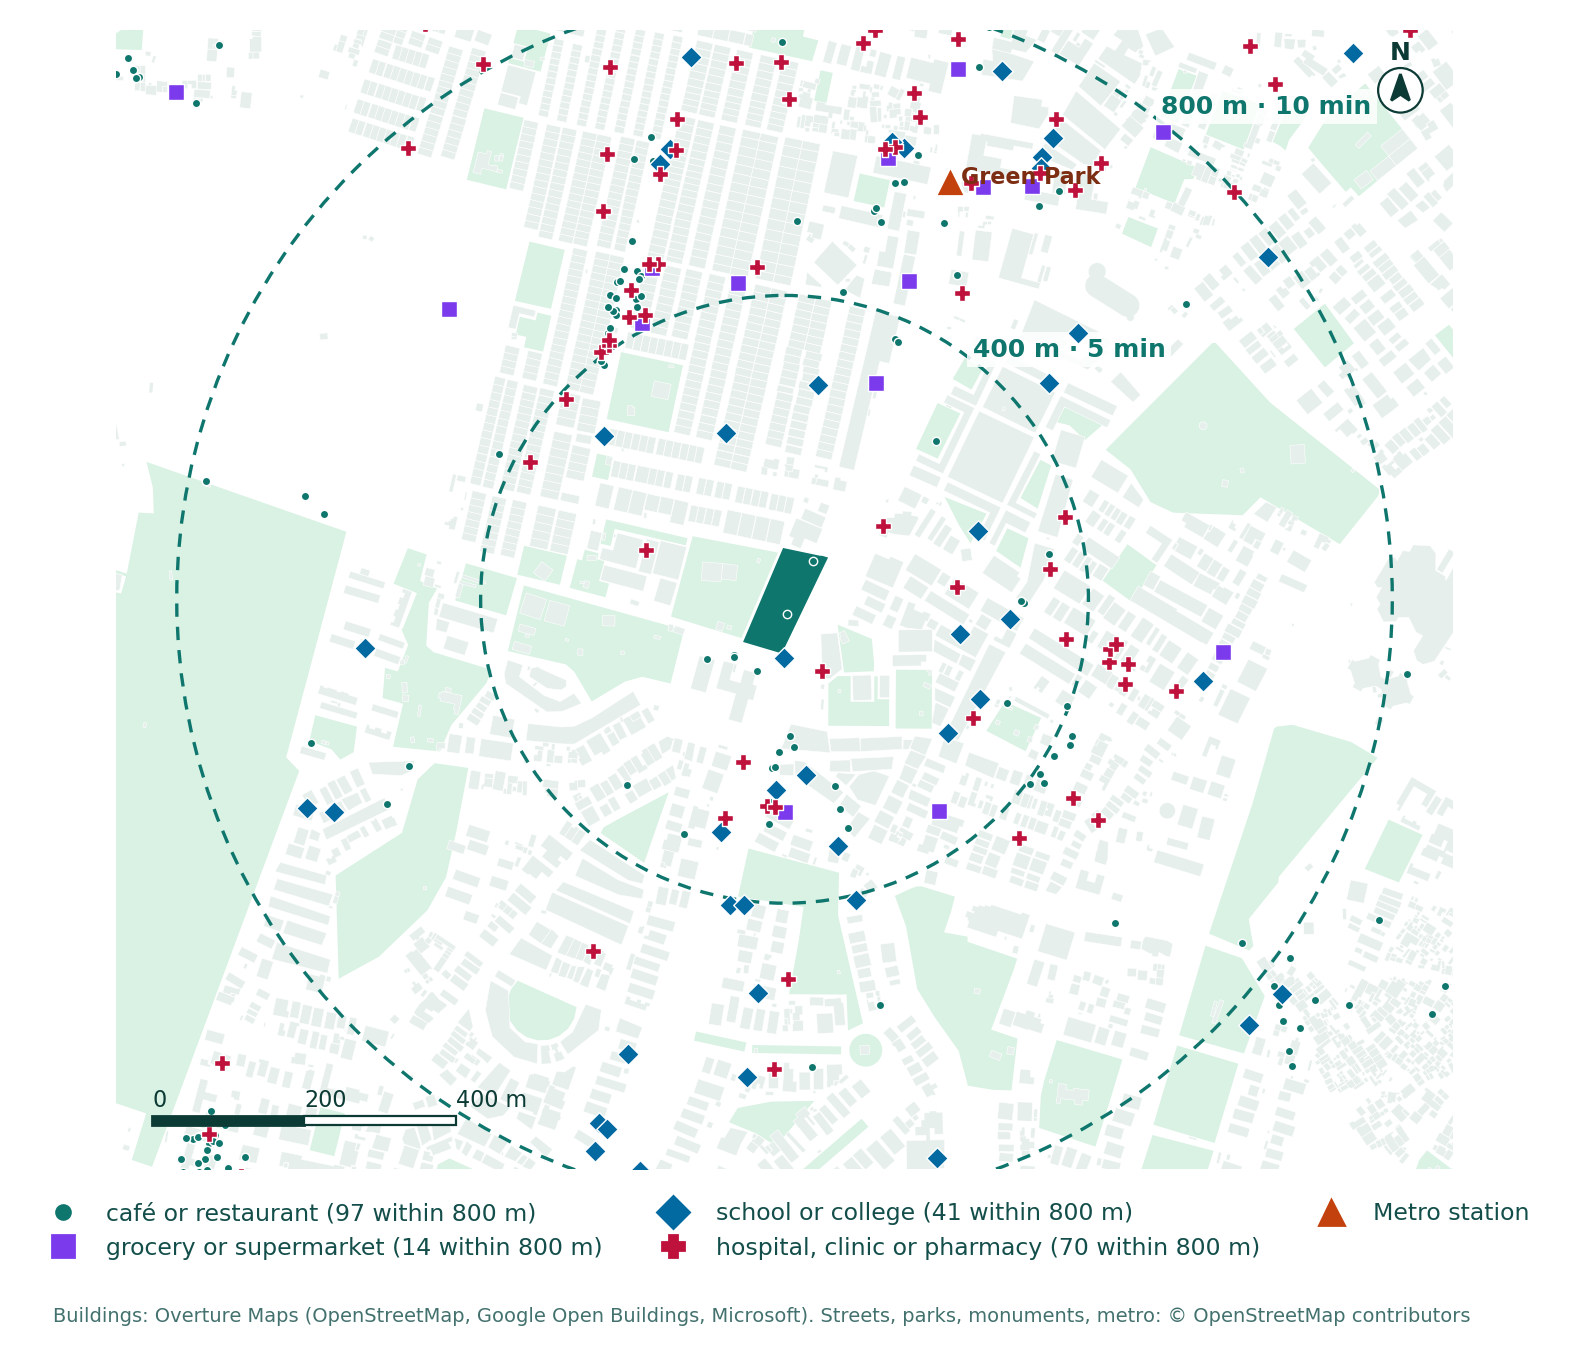
Within 800 m, about ten minutes on foot, there are 97 cafés and restaurants, 41 schools and colleges, 70 hospitals, clinics and pharmacies, and 14 grocery stores. Green Park metro station (Yellow Line) is about 590 m away, and Hauz Khas, the Yellow and Magenta Line interchange, about 1 km.
What it says for design: a household here can live with one car or none, but Delhi's rules still require parking (see below), so stilt parking will take the ground floor of most new houses.
Climate and wind
The site's climate for 2025, from the Open-Meteo archive (ERA5 reanalysis):
| Measure | 2025 |
|---|---|
| Mean temperature | 25.3 °C |
| Hottest day / coldest night | 43.7 °C / 7.6 °C |
| Days at 40 °C or more | 30 |
| Rain | 716 mm over 95 wet days |
| Share of rain from June to September | 85% |
| Humidity | 28% in April, 82% in August |
| Mean wind speed at 10 m | 1.8 m/s |
ERA5 averages over a grid of roughly 25 km, so it smooths extremes: weather stations in Delhi often record hotter days than this.
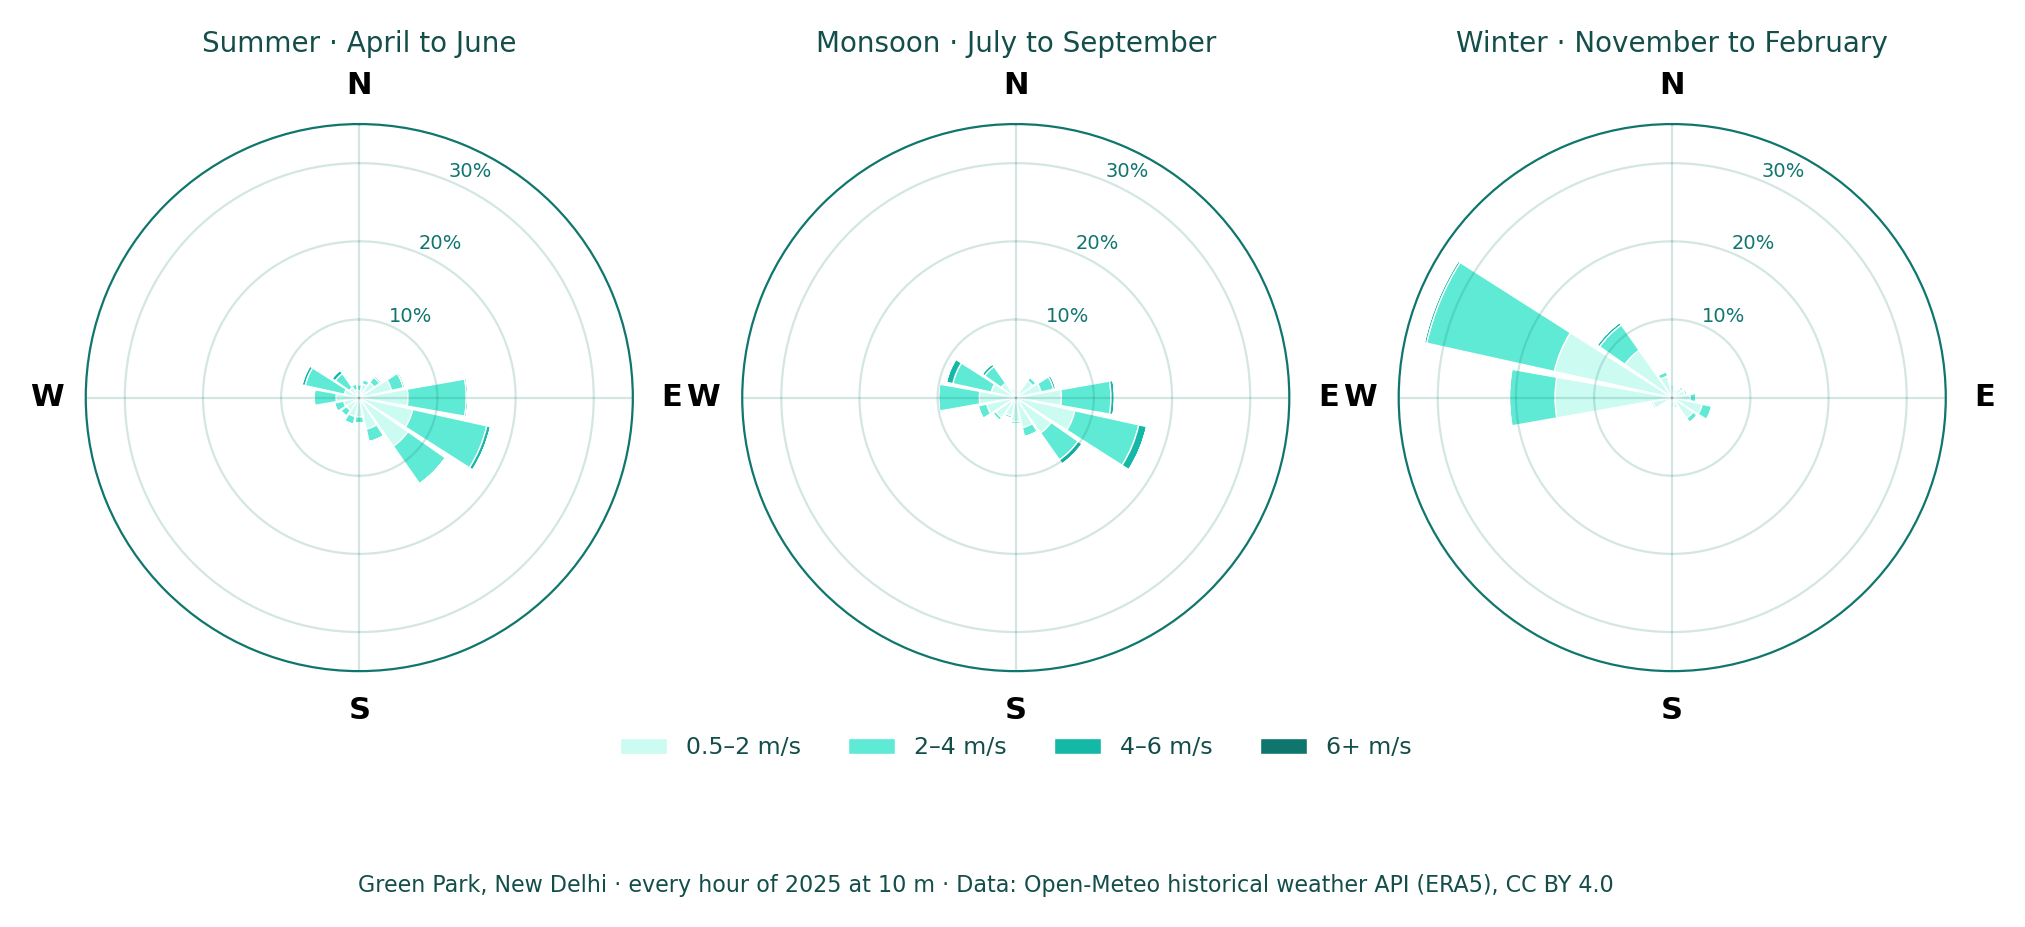
The wind changes with the season. In winter it comes from the west (43% of hours) and north-west (30%); in summer and the monsoon it comes from the east and south-east. Winds are light all year, 1.8 m/s on average.
What it says for design: in a light-wind city, cross-ventilation needs openings on both the east and west sides of a room and a stack effect through stairs or courts; the west face, which takes the April to June afternoon sun at 40 °C, needs the deepest shading and the fewest openings.
Sun and shadow
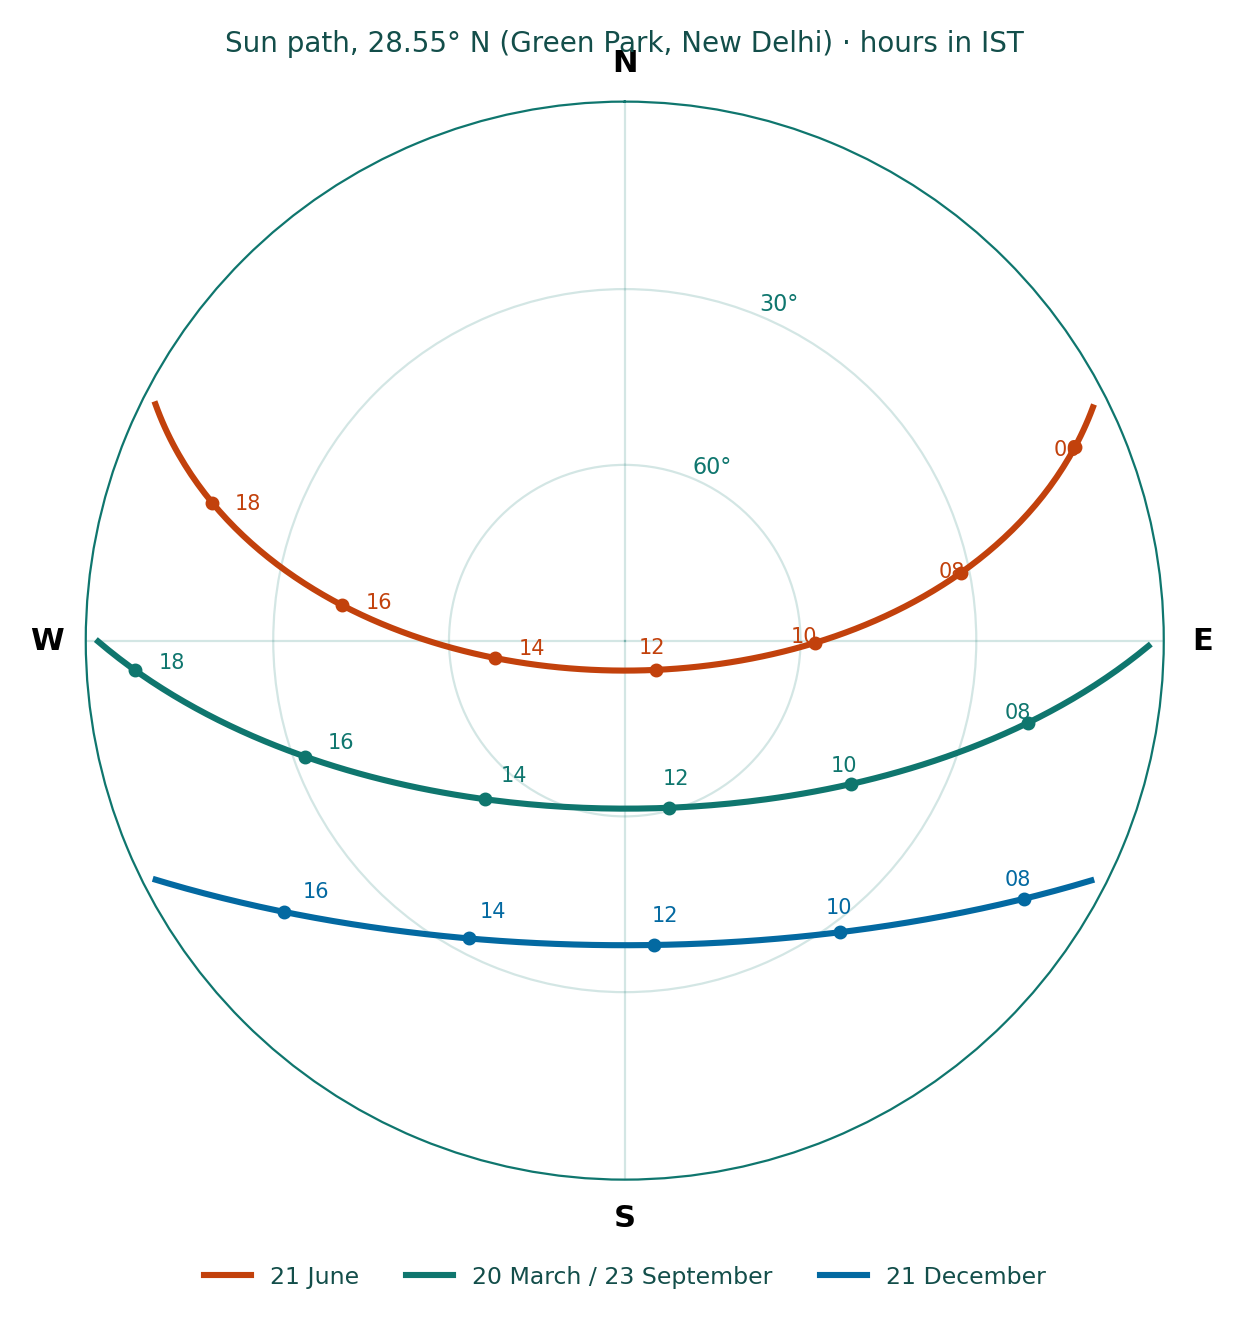
At 28.55° N the sun is almost overhead in June, 85° at noon, and still 38° on 21 December. A 15 m house throws a noon shadow of about 19 m in midwinter, a quarter of what an Amsterdam canal house of the same height throws. The problem here is too much sun, not too little: on summer mornings and afternoons the sun is low in the east-north-east and west-north-west, so roofs and the east and west walls take most of the heat.
Rules: a 300 m² plot in this block
Delhi's new master plan, MPD-2047, was notified on 20 August 2026. The figures below are the plotted-housing norms of MPD-2021 as set out in the Delhi Development Authority's 2023 handbook. Check them against MPD-2047 and its regulations before relying on them.
| Rule (plot of more than 250 and up to 500 m²) | Figure | On a 300 m² plot |
|---|---|---|
| Maximum ground coverage | 75% | 225 m² |
| Maximum FAR | 225 | 675 m² of floor area |
| Maximum dwelling units | 6 | 6 |
| Minimum setbacks (front, rear, side, side) | 3, 3, 3 and 0 m | One side can be built to the boundary |
| Maximum height | 15 m, or 17.5 m with stilt parking | Stilt plus four floors |
| If setbacks stop you reaching 75% | The setbacks of the next smaller plot size may be used | Front setback of 3 m only |
| Parking | 2 equivalent car spaces for plots of 250 to 300 m² | 2 cars |
| Green building rules (plots of 105 to 500 m²) | Rainwater harvesting, solar PV, solar water heating, waste segregation | All four |
Plans are approved by the MCD through its online building permit system; a plot of 105 to 500 m² under 15 m is "low risk", with a fast route. Here the NMA permission comes first. Test your own plot with the FAR calculator.
The synthesis: what this site asks for
| Fact | Design move |
|---|---|
| Inside the 300 m regulated area of three ASI monuments | Apply to the NMA first; keep height and roofline modest and test views from Bara Khamba |
| Plot rules: 75% coverage, FAR 225, setbacks on three sides | Stilt plus four floors with a side-court plan; use the zero side setback for the service core |
| West faces take 40 °C afternoon sun | Solid, shaded west wall; living spaces to the north and east |
| Light winds, east in summer and west in winter | Openings on both sides of each room and a ventilating stair |
| 85% of rain in four months | Rainwater harvesting sized for monsoon peaks; covered terraces |
| Metro 590 m away, but parking required | Stilt parking for two cars; keep the street edge green |
Two real sites, the same headings, opposite conclusions: in Amsterdam the analysis asks for more sun and a continuous street wall; in Delhi it asks for shade, ventilation and patience with heritage approvals.
How do you present a site analysis?
Keep one idea per sheet: a map, a sentence and a design consequence. Common formats:
- Site analysis board or A1 sheet for crits and competitions: figure-ground, sections and the synthesis diagram. See how to present a site analysis board.
- Site analysis report for clients and planning: chapters for each heading, sources at the end. See site analysis report: structure and a sample.
- A shared board where the team pins maps, photos and decisions, such as an UrbanEyes board with the site's maps as live cards.
What tools do architects use for site analysis?
Architects mix open data, GIS and CAD. A typical set: OpenStreetMap or Overture for buildings and streets, a climate source such as Open-Meteo or EnergyPlus weather files, a sun path tool, and CAD or Rhino for the drawings. Platforms such as UrbanEyes Site Analysis put these together for any address: context maps, 50-plus figures, climate, sun and wind, and feasibility, each with its source. For a fair overview, see the best site analysis tools for architects and free site analysis tools that export real data.
Where does the data in this guide come from?
- Buildings, water, ages, uses and stops: OpenStreetMap (© OpenStreetMap contributors, ODbL); Dutch building ages come from the BAG register via OpenStreetMap.
- Climate and wind: Open-Meteo historical weather API (ERA5 reanalysis), CC BY 4.0, 2025.
- Sun positions: NOAA solar position equations.
- Delhi buildings and places: Overture Maps (OpenStreetMap, Google Open Buildings, Microsoft ML Buildings); streets, parks, metro and monuments from OpenStreetMap.
- Delhi rules: DDA Handbook on Development Controls for Residential Development (2023, MPD-2021 norms); Unified Building Bye-Laws for Delhi 2016; AMASR Act 1958 as amended 2010; ASI Delhi Circle list of centrally protected monuments; MPD-2047 notification S.O. 4597(E), 20 August 2026.
- All figures were made with UrbanEyes from that data on 21 and 22 October 2026.
Frequently Asked Questions
What is site analysis in architecture?
Site analysis is the study of a site and its surroundings before design: context, history, access, climate, sun, wind, landform and planning rules. Its purpose is to find what the site offers and limits, and to turn that into design decisions.
What are the main elements of site analysis?
Location and context, built form, history and heritage, uses, access and movement, climate, sun and shadow, landform, planning rules, and a synthesis of opportunities and constraints.
How long does a site analysis take?
A desk study used to take one to three days per site. With open data tools it takes about fifteen minutes to an hour, plus a half-day site visit and the time to write the synthesis.
What is the difference between site analysis and site planning?
Site analysis studies the site as it is. Site planning uses that analysis to place buildings, access, open space and services on it.
Can I do a site analysis online for free?
Yes, much of it. OpenStreetMap, Open-Meteo and free tools like the sun path diagram cover a lot, and UrbanEyes gives a free preview of any address and a free 350 m map ring. Planning rules and the site visit still need local checking.
What rules apply to a residential plot in Delhi?
Plotted housing follows the Delhi master plan (MPD-2047, notified on 20 August 2026; check its regulations against the MPD-2021 norms) and the Unified Building Bye-Laws 2016. Under the MPD-2021 norms, a plot of 250 to 500 m² may cover 75% of the ground at an FAR of 225, up to 15 m high or 17.5 m with stilt parking. Within 300 m of a protected monument, the National Monuments Authority must also approve.
What should a site analysis conclude with?
A short list of design moves, each tied to a fact from the analysis, and one diagram that shows the opportunities and constraints together.

Vinayak Tiwari
Founder, UrbanEyes
Computational designer trained at IAAC Barcelona. Vinayak built every UrbanEyes product, from Site Analysis to Maps and Boards, after years of doing site studies by hand.
We analyse, you design.
Run data-backed site analysis with UrbanEyes: maps, metrics, and reports in about 15 minutes.